Introduction
The year 2024 will be remembered as a year of elections and power shifts. Incumbents across the globe - either fully lost their power or were significantly weakened across the board. Churn, in the spirit of Samudra Manthana, signifies transitions, the ending of old orders, and the beginning of new ones. While it's difficult to find a perfect parallel for a year like 2024, public opinion tends to be volatile, and certainty around any one outcome (or uncertainty, as statistics might have it) tends to be low in times of churn. This was observed in democracies worldwide, including the UK, India, and most recently, the US, where Former President Trump clinched all 7 swing states in what was supposed to be a close race according to various polling benchmarks. There are several reasons for the globally synchronized anti-incumbency trend but a rather simple reason is that across the world, people just aren't that happy and have made that crystal clear at the ballot box.
See Time Magazine's detailed coverage of elections around the world in 2024.
As it turns out, 2024 is also a year of churn for survey statistics and its sister-field public opinion polling, a discipline that has long been the rock for rationalizing the decisions of those in power, and in some cases, informing them too. There were two major instances of pollsters not picking up on the anti-incumbency trend, incidentally in the two largest democracies in the world, India and the USA. In the sweltering summer of 2024, India held its general elections, in which majority of the polls were found to be off the mark. The reputation of pollsters took a major blow, to the extent that the most renowned pollster in India was seen crying on live television after getting the numbers wrong. The nearly year-long election exercise in the U.S. gave all political observers a mini heartache in the first week of November when Ann Selzer of The Des Moines Register's final poll for Iowa was released showing Vice President Kamala Harris surprisingly in lead in Iowa.
For those unacquainted with the US elections, Iowa is, or at least used to be, a bellwether state with a historical legacy in public opinion polling, including luminaries like George Gallup of the Gallup Polls, who hailed from the state. For those familiar with Indian elections, Iowa is somewhat akin to the Phalodi Satta Bazar in the state of Rajasthan. A somewhat trivial yet legitimate reason for my fascination with Iowa is its almost perfect symmetric map, which looks like it was designed by a perfectionist unable to choose between a square and a circle!
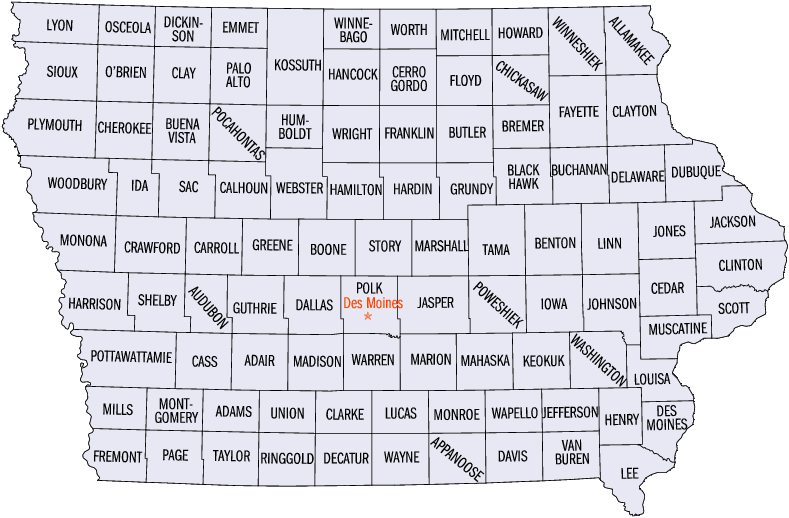
My motivation for this post is not to dive into election needle models or 50-50 horse race predictions by the likes of Nate Silver - which I hope to address another time. Instead, we will focus on the outcome of the US Presidential Election through the prism of surprising shift in polling that took place in Iowa.
The Mystery of Selzer's Final Prediction
Ann Selzer’s final Iowa poll predicted a +3 percentage point lead in favor of Vice President Kamala Harris, but the final result turned out to be +13 for Trump, a massive 16-point polling miss, comparable to the 19 point miss in Wisconsin in 2016. In some ways, at least the polling miss in 2016 was based on Wisconsin’s polling average. But what makes 2024’s polling miss astonishing is that:
We are eight years into Trump-world (America post-2016), and the political factions are well understood and established. As a very-simplistic shorthand, Trump republicans are more likely to be: men (bros), living in rural parts and less-educated (without a college degree). These demographic variables are used by several pollsters in weighting process in order to balance their samples.
It was the best pollster in the U.S. who got it massively wrong.
To be fair, the political factions did shift a fair bit in 2024 with former Democrats Tulsi Gabbard and more importantly Robert F. Kennedy Jr. joining forces with Trump and the Republicans.
There are a couple of key questions here that I want to explore in this post:
First, why was Selzer's final poll released a week before the election in November so far off base?
Second, there were three polls from Selzer, each of which are snapshots of the electoral mood at that time. The first was released in June, when incumbent President Joe Biden was still in the race. That poll showed Trump ahead of Biden by 14 percentage points in Iowa. The second was released in September, a month after incumbent President Biden dropped out of running and Vice President Harris entered the race. This was a big one, which showed Trump still leading by 4 points but with the race significantly tightening by 10 points. The final poll, released on November 2, shocked political observers with Harris leading Trump by 4 points - which, in hindsight, shouldn’t have been a shock at all. So the second question is: Did the trend in those three polls from June to November reflect the real, ground-level reality? Or was Selzer wrong about that too? Was Harris ever really ahead in the race?
In fact, Selzer’s final Iowa poll was so shocking to me that I went from declaring the race for Trump 12 days prior to the election to predicting a 60-40 race for Trump (if I could even put a number on it). After my "unsuccessful" forecast on the Indian General Election 2024 going for the incumbent Bharatiya Janata Party and Prime Minister Modi (and even co-authoring a book on it), could I have been wrong about this one too?
I wrote to my colleague about this, who had initially predicted a win for Harris based on the women’s vote, and by that point, I had successfully convinced him otherwise. One can only be 100 per cent sure of an outcome closer to an event but all the signs pointed to Trump's return to White House throughout the year and even before. The mammoth early voting numbers for Republicans unlike the previous election cycles due to a shift in rhetoric from Trump on early voting and the efforts of his new allies Musk & co meant that unless there was a blue wave on election day, this was Trump's election to lose. However, smart folks such as Tom Bonier at TargetSmart, a Washington D.C. based firm specializing in political data, who had access to much more internal data were saying that Republicans were simply cannibalizing their election day votes by voting early and that election day would see a sea of blue voters. That partly made me skeptical of my own analysis of early voting data but the one that finally sealed it for me in favor of Trump was Former President Obama's desperate plea to Democrats and the general public, with a mixed tone of instruction and imploration, urging them why they should not be voting for his arch-nemesis, with his legacy on the line. This had to be it - forget the data skull drudgery - my instincts which had partly deserted me in the summer couldn't be wrong again, could they?!
Reflexivity between voters and candidates is an inherent feature of politics in the modern era of social media and voter targeting, which means campaigns always have more internal data on voter preferences at any point of time and adjust their messaging and tactics accordingly. Per this thesis, Obama's messaging signaled Democrats were struggling to get their base on board, forget the independent and undecided voters. It wasn’t just me however — several others in the blogosphere sensed the palpable ebbs and flows in momentum (or vibes, as we now call it) as the race moved through 2024. And then came Ann Selzer’s final poll which was truly a shock to my system.
The Real Impact of Selzer’s November Poll
The impact of Selzer’s final poll was not just confined to political bloggosphere however. The US equity markets which had been rallying until then in anticipation of Trump victory stalled, risk-on assets like Bitcoin dropped in value, and Trump's odds of victory reversed in political prediction markets such as Polymarket. For anyone in these spaces, Selzer's final poll was nothing short of a seismic event and there was a major shift in the narrative. Narratives are important (perhaps always have been), but more so in the era of social media and culture wars, and so much so that even economists have acknowledged them!
See Bob Shiller's 2019 book Narrative Economics. The joke goes something like Economists are always the last to show up at the party, but at least they bring the receipts!
This is the cause of incoming President Donald Trump's grievances and more importantly the basis behind his consumer fraud lawsuit filed against Selzer and The Des Moines Register post the election. "The Harris Poll was no “miss” but rather an attempt to influence the outcome of the 2024 Presidential Election." says the civil lawsuit against Selzer and The Register. It further goes on to attribute intention on Selzer saying "Selzer’s polling “miss” was not an astonishing coincidence - it was intentional". The allegation is that Selzer released her final poll in order to depress potential election day Republican and undecided voters a week prior to the election.
"As President Trump observed: “She knew exactly what she was doing.” " - Lawsuit against Selzer and the Register
There have been various hypothesis as to why Selzer's final Iowa poll was so far off from the actual result. In a rather unprecedented move, Des Moines Register have released the cross tabs of final poll (but unfortunately not yet of all 3 polls). Selzer herself wrote an postmortem op-ed in the Register, has appeared on multiple interviews, and has put out a more detailed postmortem analysis document in the public domain addressing possible explanations albeit finding "nothing to illuminate the miss". I recommend interested readers to go through Selzer's explanations themselves. However, based on some doubts I had at that time pouring over the final poll document, some clues gleaning from the cross tabs released by the Register and other publicly available information since, I present some possible explanations below.
Turnout Modeling: The first key element that contributed to the inaccurate prediction was Selzer’s estimated turnout rate. Selzer's final poll predicted an 81% turnout, while the actual turnout in Iowa was 74.2% - a 7% difference which is significant but not enough to entirely explain the 16 point miss. Estimating the composition of electorate pie from the eligible voting population is the first piece of the puzzle in order to produce any forecast and Selzer's method of conducting polls using random-digit dialing instead of relying on voter files is a key difference to other pollsters. It is notable however that other political experts such as Michael McDonald - Professor of Political Science at University of Florida who regularly produces turnout estimates based on “voting-eligible population”, past turnout, mail ballots and in-person early voting - estimated about 1.65 million ballot cast in Iowa in 2024 was pretty close to the final 1.66 million votes cast.

Likely Voter Composition: Of the initially contacted respondents using Random Digit Dialing (RDD), Selzer only considers voters who said they have "Already voted" or will "Definitely vote" as their response. Selzer builds her respondent base in a way that all Iowa adults have an equal probability to be contacted by interviewers via landlines and cell phones. Once weighting is complete, the likely voters are defined as those who say they have "already voted or say they will definitely vote in the days before or on Election Day". In the final poll conducted in the last week of October, among the categories probably vote and might or might not vote, there were 11 percent of the initially contacted respondents who said they they would "probably vote" or "might or might not vote". It seems to be that completely discarding them as Unlikely Voters could have further contributed to the discrepancy.
Further as other have pointed out, Selzer's Likely Voter Sample contained a big share of Never Trumpers. Perhaps this could this be explained by variance, or there might have been a bias in the sample. No way to be entirely sure for now.
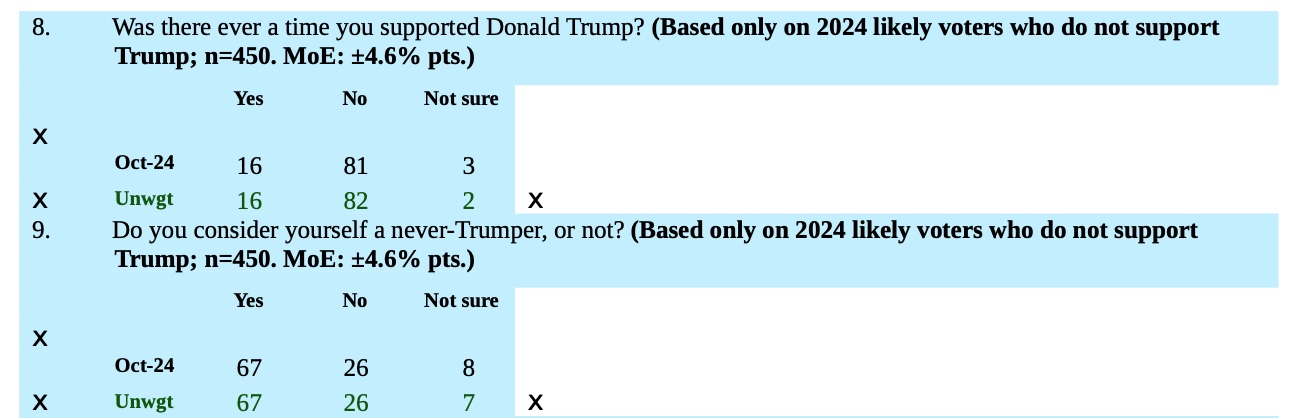
Enthusiasm Gap - Selzer's final Iowa poll revealed lower enthusiasm among Harris supporters compared to Trump supporters. Only 71% of Harris supporters were "Extremely+ Very Enthusiastic" which was down from 80% in the September poll while 76% of Trump supporters expressed similar levels of enthusiasm. This gap in enthusiasm between Harris and Trump supporters was consistent with findings from other pollsters, further suggesting a stronger, more energized base for Trump. Is it possible that Harris' voters were becoming less enthusiastic and more willing to vote for her at the same time?! If true, this suggests that many voters (specifically democrats, indepedents and cross-over voters) were on the sidelines and may have abstained from voting on the election day.
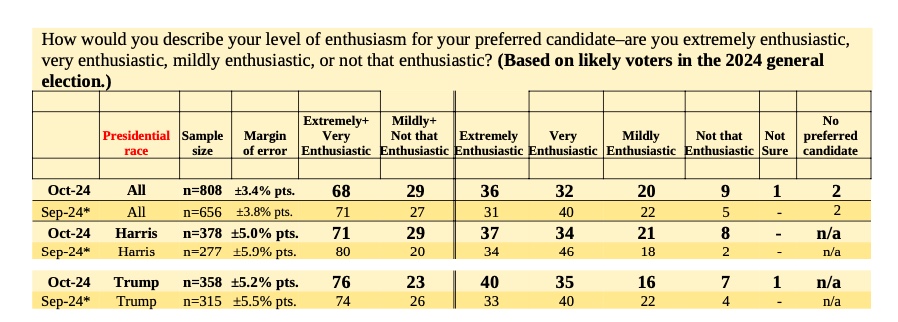
Kennedy Factor - Another possible explanation for the difference is the inclusion of Robert F. Kennedy Jr. who had abandoned his independent presidential campaign to support Trump but remained on the Iowa ballot. This was my colleague's attempt at an explanation after I had hurriedly sent him Selzer's final poll in November - add Kennedy's vote share to Trump and you get a close contest, well within the margin of error and assuming Selzer's poll is an outlier, Trump still wins. This is kind of what happened, Kennedy ended up with only 0.8% vote share in Iowa but while this might have been a contributing factor, this alone is insufficient to explain the 16 point difference! In her postmortem, Selzer lightheartedly refers this theory as "Newtonian physics" adding that perhaps the results of the poll (which had a wide reach) were more motivating for Trump voters than Harris voters.
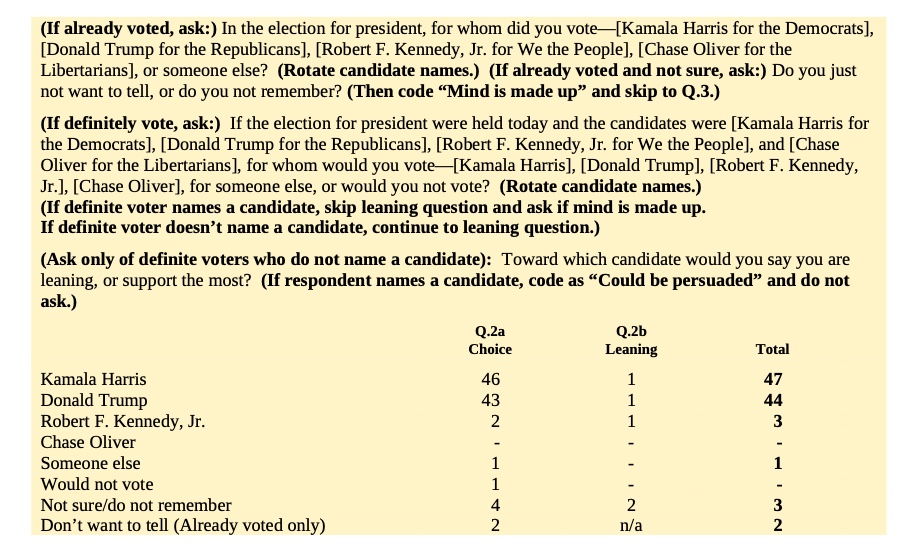
The Lying Factor - In a postmortem of the 2020 US Presidential Elections, my coauthor and I wrote about the possibility of respondents lying when pollsters asked about who they would vote for and whether this is an increasing trend over recent times across the world, especially post 2016. Our article quoted a 2020 study "Are Election 2020 Poll Respondents Honest About Their Vote?" in which 11.7% of Republicans said they would not report their true opinions - roughly double the number of Democrats (5.4%). Another study from 2020 by Berkeley Professor Don Moore and his student Aditya Kotak found "the actual vote total for a given candidate fell within the 95% confidence interval for just 60% of the polls. This degree of accuracy was reached only when the polls were conducted in the week before an election; accuracy was worse for polls conducted earlier. Polls would, in fact, need margins of error at least twice their current standard reported width to achieve 95% accuracy". The margin of error quoted here and which is reported by pollsters usually is the Sampling Error ignoring other forms of Non-Sampling Errors such as respondents lying about their candidate preference in surveys.
It is also important to note that some pollsters did get it right in the 2024 Election, and they've moved away from RDD, adopting more aggressive weighting methods, not just based on demographics, but also considering socio-political variables like party ID, previous vote behavior, and education level. But I like Selzer’s approach because it’s simple, time-tested, and minimizes the guesswork around what the electorate will look like in the future. She points out in her 2024 analysis document that her method has remained consistent, which allows us to track its performance over time and look for trends.
Selzer says, “I do not think respondents lie in any sort of consistent way. Our past final polls have been quite accurate, so lying would be a sudden change in respondent behavior… Of course, I cannot rule it out, but I tend not to think this is the case. I could hardly be in this business if I thought otherwise.” (emphasis mine). Looking at the two graphs of Selzer’s final pre-election polls, it’s clear that while her method has generally been stable, there’s been a consistent bias toward Democrats, especially since 2016. The first graph compares predicted vs. actual voteshares, showing that, although most predictions have been spot-on, 2024 stands out as an outlier. Kamala Harris was projected to perform better than she actually did, making this a glaring exception in terms of polling accuracy. The second graph tracking errors over time confirms that Selzer’s polls have favored Democrats consistently by a small margin post 2016. But once again, 2024 was different, with a much larger error than previously seen.
In light of the the trends we observe in the graphs and findings from the studies mentioned above, respondents lying about who they’re voting for might be more of a factor than Selzer acknowledges, especially post 2016, ceteris paribus. This trend is just not confined to Selzer's poll, Trump's support once again was underestimated by most pollsters. While Selzer’s simple, time-tested method has worked pretty well overall, the 2024 outlier makes you wonder if this method needs to evolve, especially with the bias toward Democrats showing up again. The idea that respondents might be lying or misrepresenting their votes could play a bigger role than we thought, and future elections might require polling techniques that account for this.
My personal view is that this might not be outright lying as much as voters being unsure of who to vote for (or abstain entirely) in a highly polarized environment where no major politician is able to a get their favorability ratings over the majority threshold. In hold-your-nose and vote elections such as the one in 2024, late movements in these groups of voters who are on the fence might be large enough to tilt the outcome in a one-sided way, especially given the idiosyncrasies of US Electoral System where only a handful of states are contested. As Selzer says in her analysis, "It’s almost like, in the end, Iowa voters treated this race as a Trump-Biden rematch", despite the see-saw of polling throughout the year as Biden dropped out, Harris entered the race and multiple assassination attempts on Former President Trump. However, the final Selzer poll in November showed relatively few undecided voters with 91% saying their minds are made up, an 11% increase from 80% found in the September poll, contrary to the expectation. Further research and data on the actual size and composition of undecided voters might help us get at a more clear understanding on this issue.
What actually happened?
As Selzer notes in her analysis, data is still incoming and the Iowa Secretary of State’s reports on this election which are yet to be released will provide further insight on the difference in turnout by various demographics. However, given that we now know the preliminary results of 2024 election, we can attempt to decipher where the shift in trends took place geographically at the county level. Specifically, is there any insight we can glean from the turnout statistics as there is a clear difference of 7 percentage points between Selzer's projected turnout in Iowa and the actual? As mentioned earlier, Democrats hold the urban pockets whereas the Republicans dominate the more sparsely populated rural areas and this division has been growing post 2016 in the U.S. The suburbs fall somewhere in the middle of this spectrum and is where there are potential voters for grabs as seen below.
The graphs below provide a visual representation of the change in total votes polled in Iowa between the 2020 and 2024 elections at the county level. The bar chart highlights that while most counties experienced relatively modest changes, a few counties saw significant increases in voter turnout, particularly in the suburban counties surrounding Des Moines and Cedar Rapids, which are marked in yellow. In contrast, urban core counties like Des Moines County show a slight decline or minimal change in turnout, indicated by the purple bars. The map below also presents the spatially representation, with suburban areas around Des Moines and Cedar Rapids showing increased voter turnout, while the urban cores appear in darker shades, signaling either flat or negative turnout growth. These patterns suggest that suburbs have become more politically engaged, while urban areas show less growth or even decline in voter participation between 2020 and 2024.
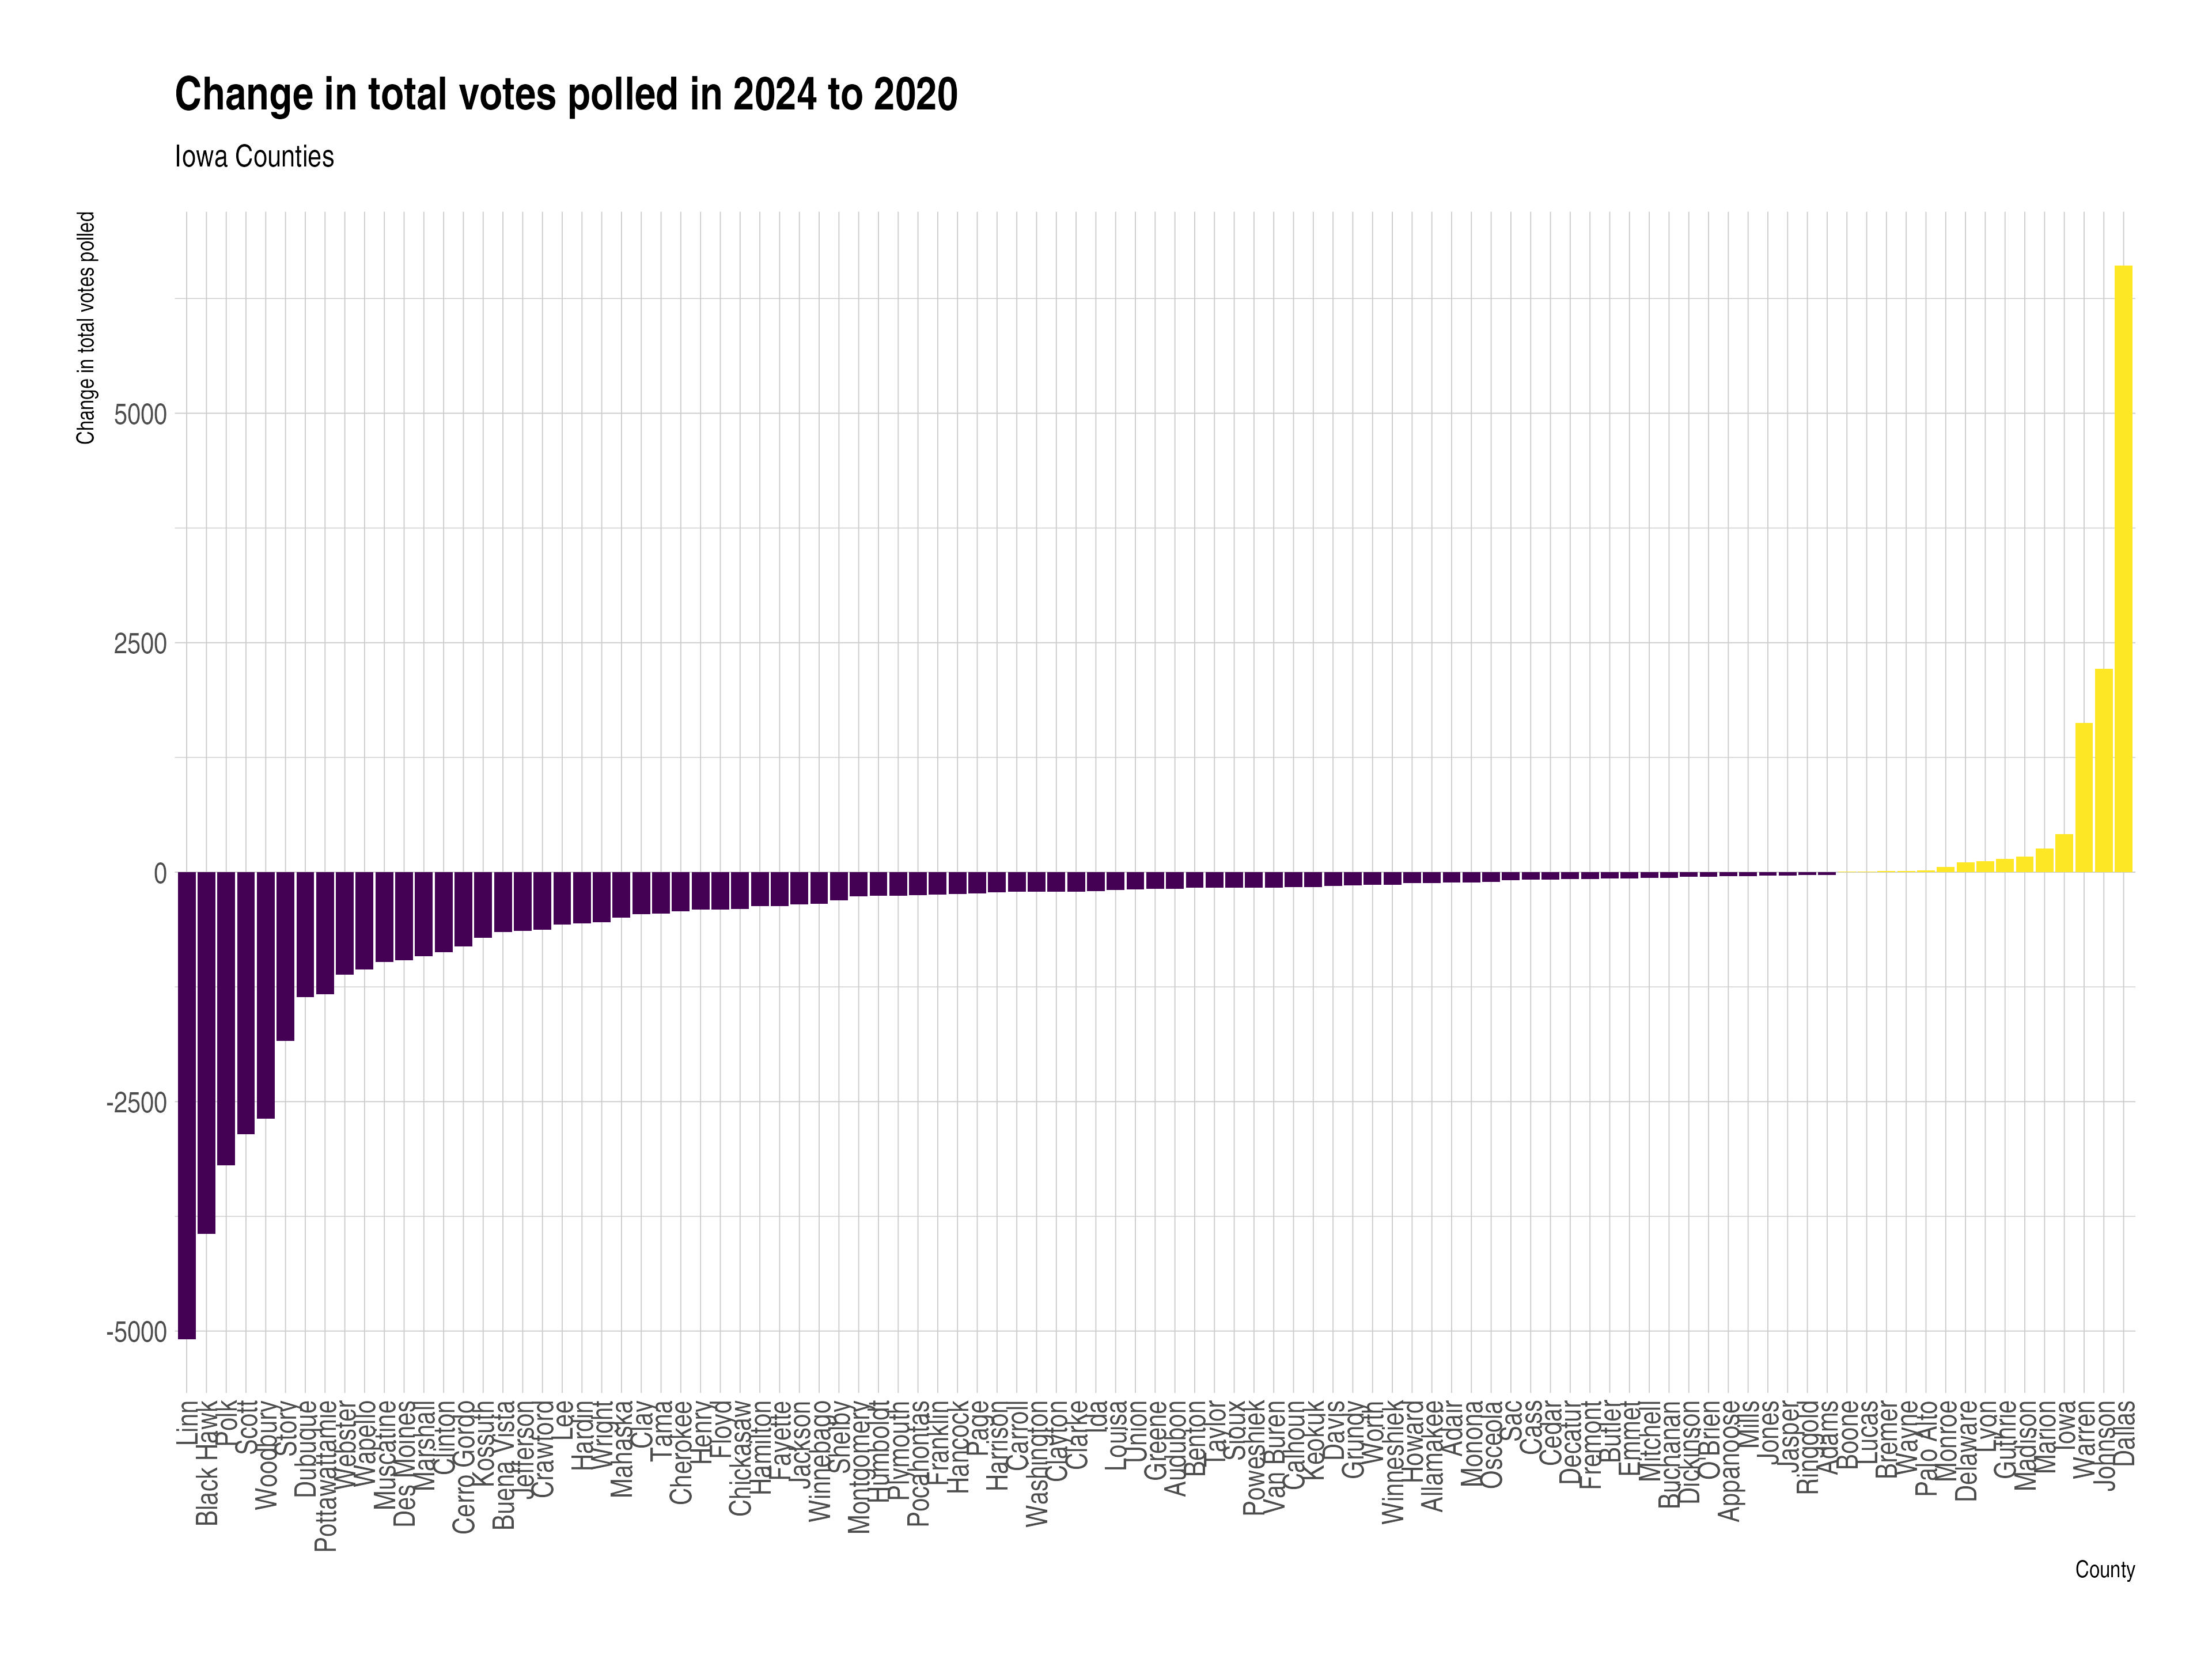
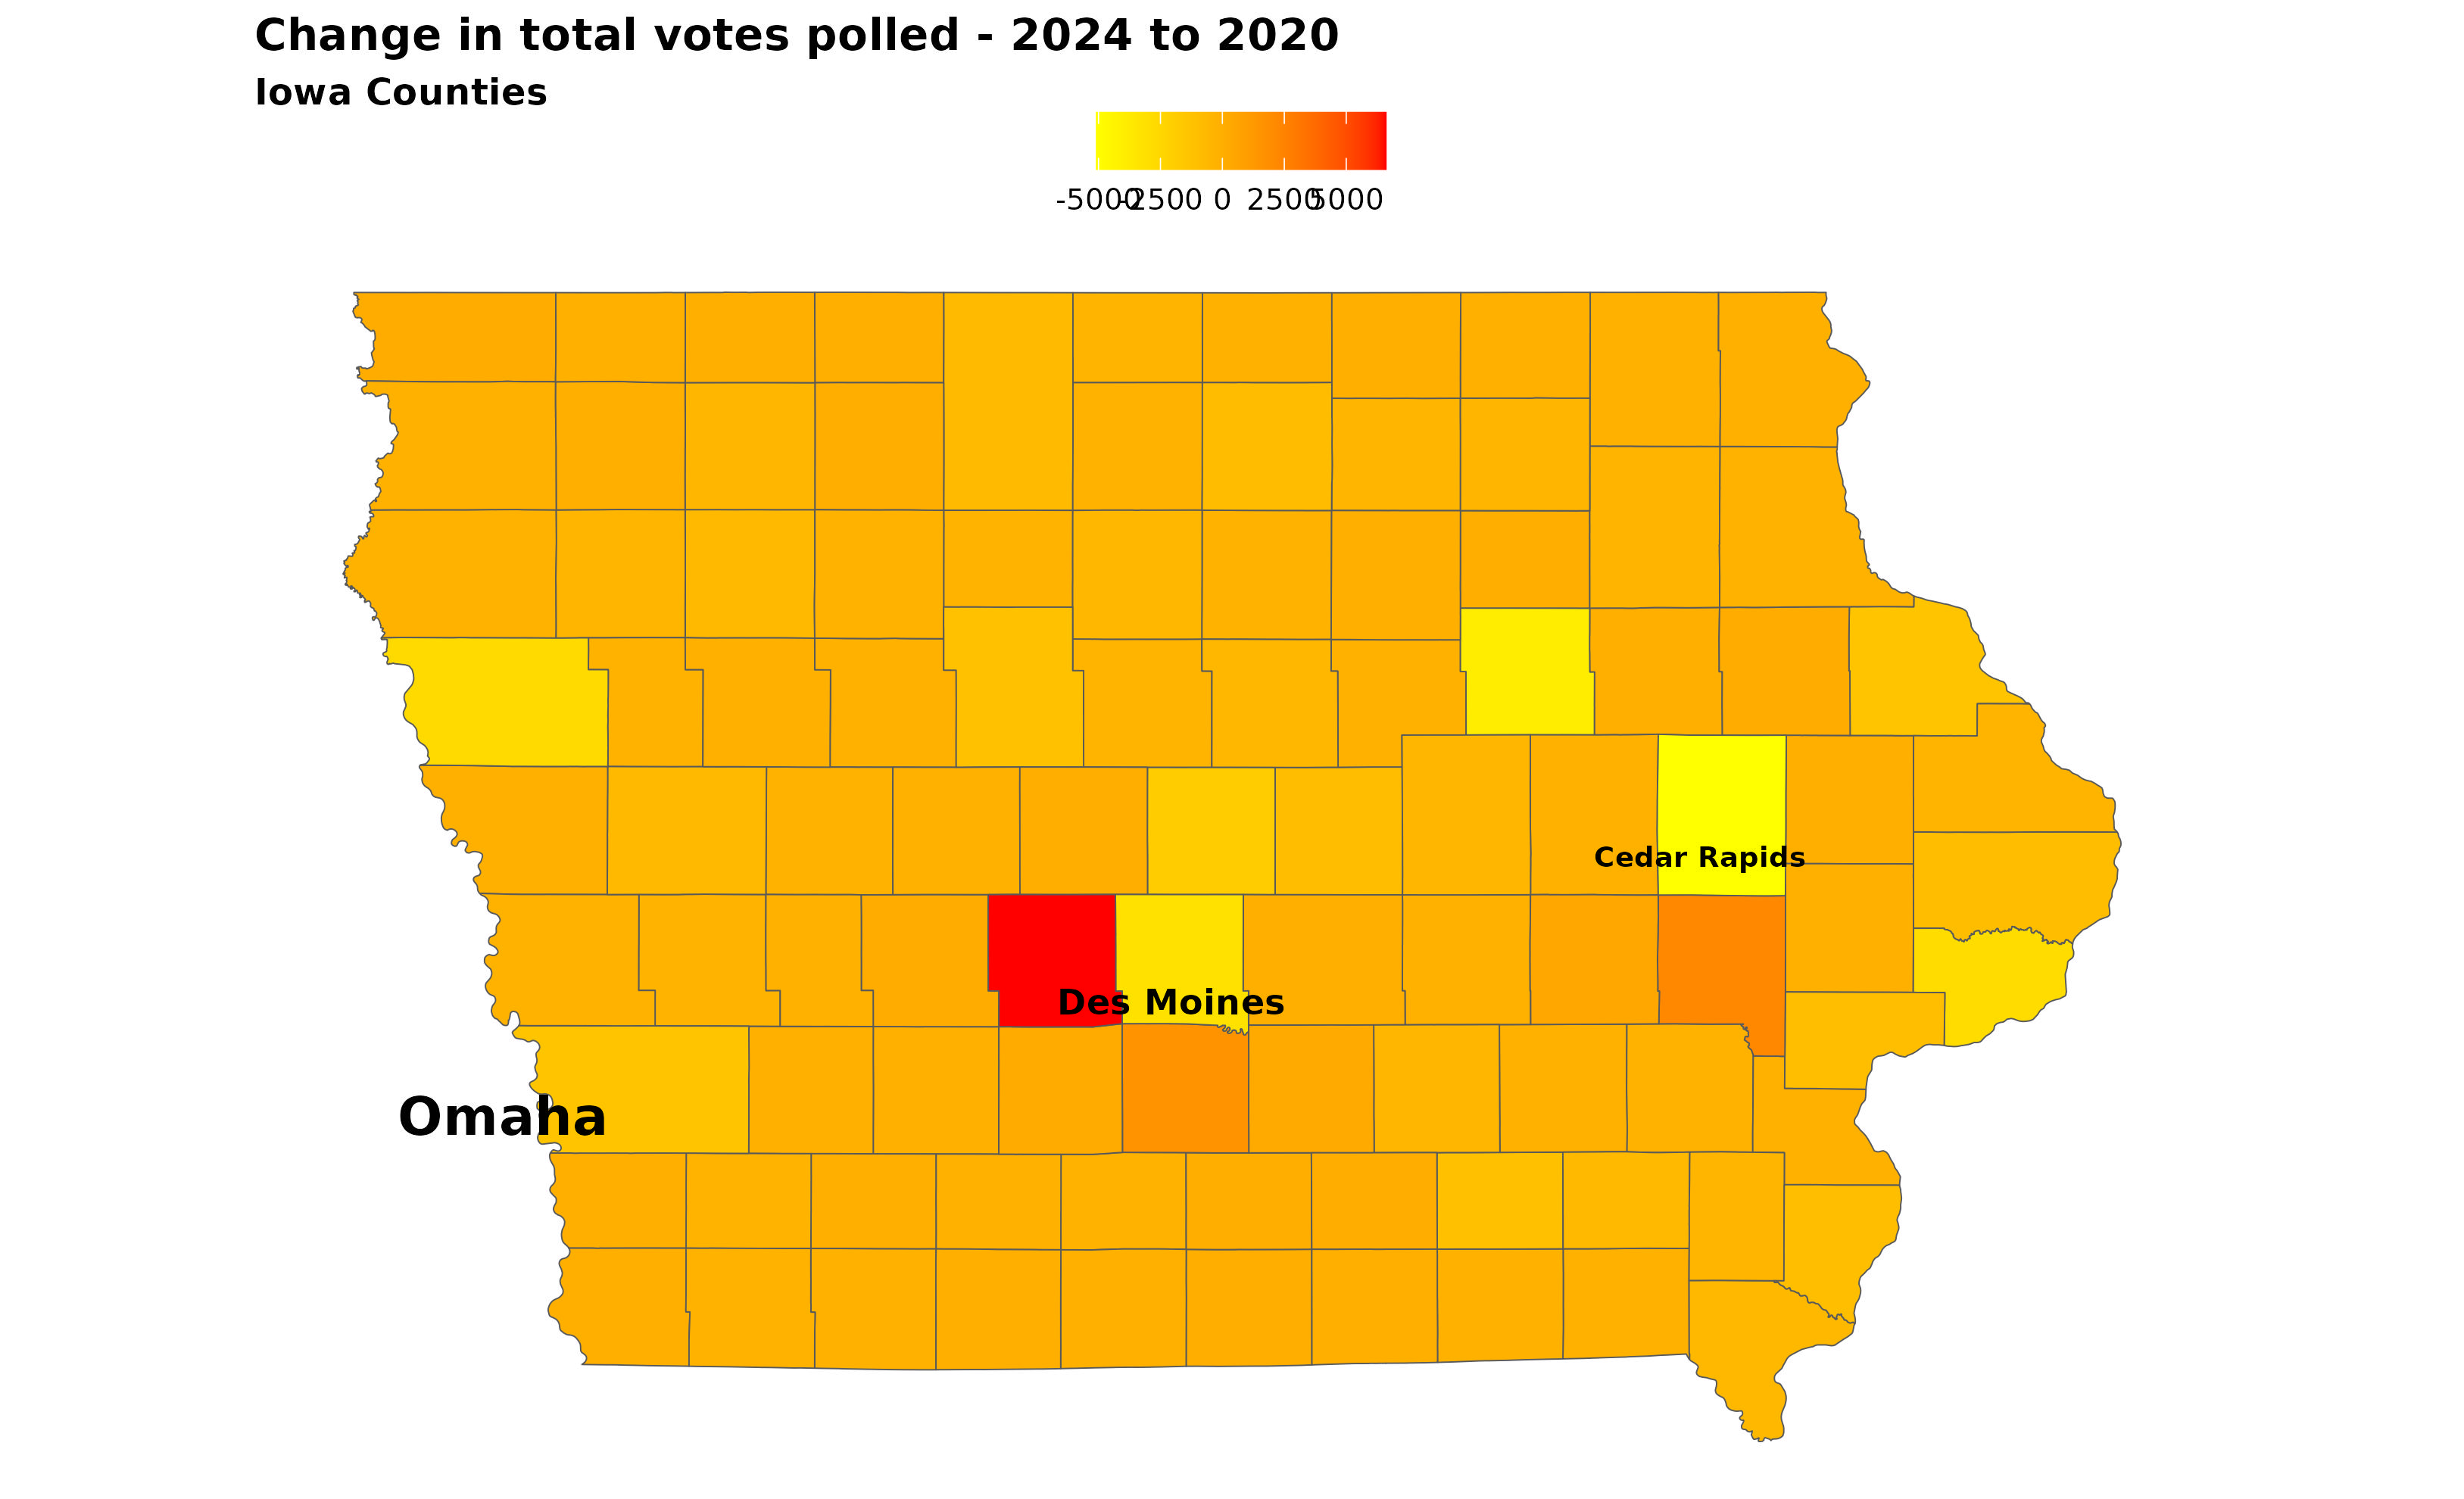
To establish these findings more concretely, we can apply the concept of spatial autocorrelation. Spatial autocorrelation measures the degree to which a variable is correlated with itself across space, helping us see how turnout patterns spread across Iowa’s counties. This concept is aligned with Tobler’s First Law of Geography, which states that “everything is related to everything else, but near things are more related than distant things” (Tobler, 1970). Positive spatial autocorrelation occurs when areas with similar values (in this case, similar turnout trends) are clustered together, while negative spatial autocorrelation occurs when areas with dissimilar values are found close to one another (i.e., dispersed).
Using this framework, we can identify patterns in voter turnout that are geographically clustered or dispersed, shedding light on the geographic shifts in turnout that contribute to the gap between projected and actual turnout numbers in Iowa. The results of Pysal’s classification, which is based on calculating the Local Moran's I Statistic for each county polygon, confirm that suburban counties surrounding Des Moines and Cedar Rapids (marked in blue and green) show higher turnout increases in 2024 compared to the urban core counties like Des Moines County and Linn County, which have seen lower turnout. For instance, Polk County, home to Des Moines, shows dispersed turnout patterns, with a notable increase in suburban areas compared to urban Des Moines, which experienced less of a rise in voter engagement. Similarly, the suburban areas surrounding Cedar Rapids such as Johnson county saw higher turnout than the urban core in Linn County, further highlighting a shift toward suburban voter engagement. These spatial patterns emphasize the growing influence of suburbs around major metros in comparison to their urban cores, which reflect changing political dynamics and demographic shifts.
The difference between Polk County and Linn County as compared to the more suburban Dallas County exhibits how suburban dynamics shifted in favor of Republicans. I have selected a few variables from the American Community Survey (ACS) to highlight those differences below.
Comparison of Polk, Linn, and Dallas Counties
| County | Polk | Linn | Dallas |
|---|---|---|---|
| Population (2020) | 490,000 | 225,000 | 200,000 |
| Median Household Income (in dollars) | 64,000 | 60,000 | 70,000 |
| Homeownership Rate (%) | 60 | 68 | 74 |
| Median Home Value (in dollars) | 240,000 | 210,000 | 280,000 |
| Population Density (per sq. mile) | 1,800 | 1,400 | 500 |
| % of Families with Children | 35 | 40 | 50 |
| Average Commute Time (minutes) | 25 | 22 | 30 |
| Education Level (% Bachelor's Degree or Higher) | 40 | 42 | 38 |
As mentioned above Democrats have historically held the urban pockets suggesting gradual disenchantment with the Democratic party establishment from urban to suburbs. This pattern of Democratic disenchantment is consistent with other preliminary findings such as Professor McDonald’s findings in North Carolina. As North Carolina is a party registration state, it is possible to analyse how the partisan composition of the electorate changed from 2020 to 2024 general elections. Based on his analysis of the data from North Carolina, McDonald concludes "These data are suggestive that at least some of Donald Trump’s 2024 victory was a consequence of Democrats voting at lower rates than 2020." It is safe to assume that this disenchantment would show up more in the urban strongholds which suggests that, in both states and perhaps more broadly, Democratic voters - particularly in urban centers - have felt disillusioned or disengaged, possibly due to shifting political priorities, a perceived lack of effective leadership, or discontent with the party's national platform. As we see from the Iowa data, this suburban mobilization contrasts with the relative apathy in urban districts, indicating a geographic and demographic shift in political engagement that mirrors the challenges Democrats faced in 2024.
Was Harris Ever Really Ahead?
Now, let's turn to Selzer's earlier polls from July (when incumbent Biden was still in the race) and September (when Vice President Harris entered the race). How did these compare to the final poll, and what went wrong? And to my second question, Was Harris ever really ahead in this race? Of course we will never really be able to definitively answer this question but there are piece-meal evidences which when stitched together can give us a picture of what might have happened.
First as seen around the world, this was an election for whoever best presented themselves as the "Change Candidate". Post Vice President Harris' entry into the race, there was a palpable sense of enthusiasm among voters who weren't keen on another rematch between Biden and Trump and a shift in narrative which is backed by shift in Polymarket odds. The most tangible evidence of this enthusiasm is the surge in small-dollar campaign contributions. Defined as donations typically under $200, small donors have become increasingly significant in U.S. elections, offering insights into voter enthusiasm and potentially influencing electoral outcomes. Research indicates that small-dollar donations can serve as a barometer for candidate support and electoral success. A study by Michael Borecki at Bowdoin College found that small donation contributions reflect genuine grassroots support. Harris raised 467 million from small donors, which is 40% of her overall fundraising of 1.15 billion and 3.5 times more than Trump who raised 133 million from small donors in 2024. It is notable that Trump out raised Hillary Clinton on this metric in 2016 and has often boasted about it.
In order to shift this tide of narrative, Trump outworked Harris by holding almost-daily press conferences in an effort to portray her as the establishment candidate at the same time circumventing the traditional media by regularly appearing on various niche as well as mainstream podcasts such as Joe Rogan to directly reach low-probability voters. During a time of difficulty, his strategy of using podcasts as a direct communication tool, offering unfiltered access to millions and changing the political landscape in ways traditional campaigns couldn’t achieve, was truly novel. My personal favorite is his appearance on Professional Golfer Bryson DeChambeau's podcast in which he showcased his surprisingly good golf skills, had a good time and spoke nothing of the election or politics for about an hour. This shift in strategy allowed Trump to not only energize his base but also reshape his image to voters who were skeptical of mainstream polls and news outlets. Edison Research shows that Trump’s podcast outreach reached significantly more people than Harris's, who was more reclusive in comparison. Meanwhile, Harris’s early lead, despite backing from the legacy media, faced growing competition as Trump’s narrative spread far more widely through the podcast circuit.
Harris' fundraising - especially from small-ticket donors - coupled with dissatisfaction of the voters who were looking for an exit from Biden-Trump status quo was giving an impression of momentum, but that support may have been fleeting evidenced by the low enthusiasm numbers by November, like sand slipping away on the shore. Like with indirect sales marketing in the pre-digital world, it is hard to get an exact measure to what extent this impacted the voters. His conversation on Joe Rogan’s podcast, which as of today has 54 millions of views on Youtube alone, gives a barometer of its reach. What it has definitely accomplished is halting the shift in the narrative towards Harris post-September and perhaps planting a seed of doubt in Democrat and Undecided voters, encouraging them to consider voting for him or at least abstaining from voting.
In closing, it is essential to understand nuances of the trends in polling, especially in times of political churn. Selzer’s final poll, as shocking as it was, is a reminder that public opinion, and the methods used to measure it, are far from infallible.
Conclusion: A New Era Beyond the "State" of Statistics
So, after all the surprises of 2024, it’s clear that the landscape of public opinion is anything but static. Polls like the Selzer Iowa poll show just how tricky it is to capture an accurate snapshot of where voters stand in such a dynamic, fast-moving world. As we saw in the election, surveys try to capture a moment in time, but we live in an age where information is constantly shifting and evolving.
Polling, in its traditional form, is a bit like trying to take a picture of a moving car - it just doesn’t capture the full picture. In today’s world, we need to think beyond the old methods and embrace more dynamic, real-time approaches to understanding public opinion. For those who have persisted thus far, this brings me to my recent paper Statistical validation of a large-scale web survey during the COVID-19 pandemic in India, which dives into weeds of this issue by analyzing a single variable of interest from a large scale survey during the COVID-19 pandemic, a period of immense churn and a foreshadowing of what is to come.
The very term "statistics" comes from the Latin word "status", meaning state or condition, and it originally referred to the collection of data about the state—governments needed it to understand their population, resources, and overall condition. Surveys, in their original form, were just snapshots of the state at any given moment. But now, in a world where information is moving faster than ever, relying solely on those static, “state-like” snapshots just doesn’t cut it anymore.
As we move forward, we will need more dynamic models that don’t just collect data at a single point in time, but that also capture the fluidity of public opinion in a rapidly changing environment. Whether it's using real-time data from social media, prediction markets, or even behavioral data, we’ll need tools that can keep up with the pace of information and the complexity of modern world. As I look around, there are numerous examples of old methods not quite adequate to the demands of the new world - this shift towards complexity will be a key topic in my upcoming posts in this blog series, so stay tuned.