Introduction #
I predict the Republicans are going to lose the House on November 3rd, and could lose 5-10 Senate seats, including in places like Texas, South Carolina and Kansas, and maybe even Florida. Kansas has not elected a Democrat to the US Senate since 1932; Texas last did so in 1988 (Lloyd Bentsen), and South Carolina in 1998 (Fritz Hollings). Breaking those runs would be a big dent in Trump himself and in Trumpism – including the claim that he had assembled a coalition which would outlast him. Florida, which last elected a Democrat to the US Senate in 2012 (Bill Nelson), is my stretch call. I have no seat model to offer here: this is my forecast, not a polling projection – and calling the Senate wrong would still be getting something rather important wrong!
Before getting into why, a quick detour to Iowa, where this series began. In In Defense of Ann, I wrote about Ann Selzer’s final poll showing Vice President Harris ahead in a state Trump went on to win by 13 points. In Turnout Tales, I suggested, half in jest, that the Democratic flip in Iowa’s Senate District 35 meant Selzer had perhaps been early. The New York Times/Siena poll of October 3 now has Republican Ashley Hinson at 48% and Democrat Josh Turek at 47% in the Iowa Senate race. I would have loved to see a final Selzer poll this time around, but she has since retired from election polling. Selzer’s final 2024 poll was wrong by 16 points. A close race now would give us no reason to revise that assessment. What interests me is how much the electorate has moved since.
The first four posts kept returning to political churn, the Samudra Manthana of the first post, and incumbents who seemed unable to understand why voters were unhappy with them. In The Trump 2.0 Doctrine, I used Clayton Christensen’s disruption thesis, with a somewhat indulgent Manchester United comparison, to think about how this happens. Here I want to develop that idea and apply it to the election next week.
I will call it a theory of political disruption. The claim is that centres of power lose to challengers who can reach the forgotten fringes directly. The Great DeAlignment is the longer background to this process: voters gradually losing their attachment to both parties, providing the soil in which a disruptor can grow. There is a lot of room to get carried away with such a theory, so towards the end I have written down what I will be watching on November 3rd and how I intend to grade this forecast.
A theory of political disruption #
I first came across Clayton Christensen’s The Innovator’s Dilemma at university. His explanation of why successful companies fail has stayed with me since. A few years later I found Ben Thompson’s Stratechery, which I read and listened to religiously, including on walks and commutes. Over time I began to see their ideas about companies as a description of the age we live in, and started wondering how far they applied to politics.
Christensen describes incumbents improving their products for the customers they already serve, while a challenger finds people whom those incumbents have neglected. Thompson’s Aggregation Theory extends the argument into an internet economy where distribution is freely available and the relationship with the end user becomes much more important. Political parties had enjoyed a similar advantage in distribution. They selected candidates and decided which issues deserved airtime; reaching voters generally required going through them or through the media institutions around them.
The centres I have in mind are both geographical and ideological. Washington, Lutyens’ Delhi, London and Brussels accumulated expertise and authority, and the people working in these capitals increasingly spoke to one another. Centrism supplied the governing assumptions of the Third Way and the Washington Consensus. Within those limits, politics was largely a question of competent administration. Meanwhile, voters in deindustrialised towns and rural counties, and young people with little stake in the existing system, had reasons to question the arrangement itself.
The centre stopped listening to these voters, and that is the opening through which disruption walks in. A challenger can look inadequate by the establishment’s standards and still be speaking to people the establishment has ceased to understand. Social media makes it possible to reach them without first securing the approval of those who decide what counts as a serious political position.
Martin Gurri approaches much the same problem in The Revolt of the Public, first published in 2014 and reissued in 2018. He describes a conflict between the Center, made up of hierarchical institutions, and the Border, a networked public which has gained access to information those institutions once controlled. His public is very good at rejecting authority and rather less good at agreeing on what should replace it. That difficulty bites once the challenger has won an election and has to govern.
Thompson and Allworth’s The Internet Rainforest conversation on Exponent offers a useful image: a few very large trees and considerable life on the forest floor, with little surviving in between. Applied to politics, it helps explain the squeeze on parties trying to appeal somewhat to everybody while their challengers build intense relationships with particular groups. Of course, parties and media gatekeepers still exist; this is my extension of the business analogy, and I don’t want to stretch it into a literal equivalence.
Trump’s takeover of the Republican Party in 2016 is the obvious example. On experience and policy papers, etc., he compared poorly with the people the party considered qualified. Yet he had a direct connection to voters through Twitter and rallies, with plenty of help from cable networks which could not stop covering him. Bernie Sanders reached a different set of neglected voters, especially the young, and challenged a Democratic nomination process whose establishment had already settled on a candidate. He lost the nomination twice, but moved the party towards his positions.
For an Indian audience, Modi’s 2014 campaign is a familiar parallel. The outsider from Gujarat went around the English-language commentariat of Lutyens’ Delhi, using social media and holographic rallies to reach an aspirational constituency the Congress had taken for granted. These are very different politicians. What they share is how they reached voters from outside the accepted centre, and how the centre kept mistaking its own dislike of them for an assessment of their chances.
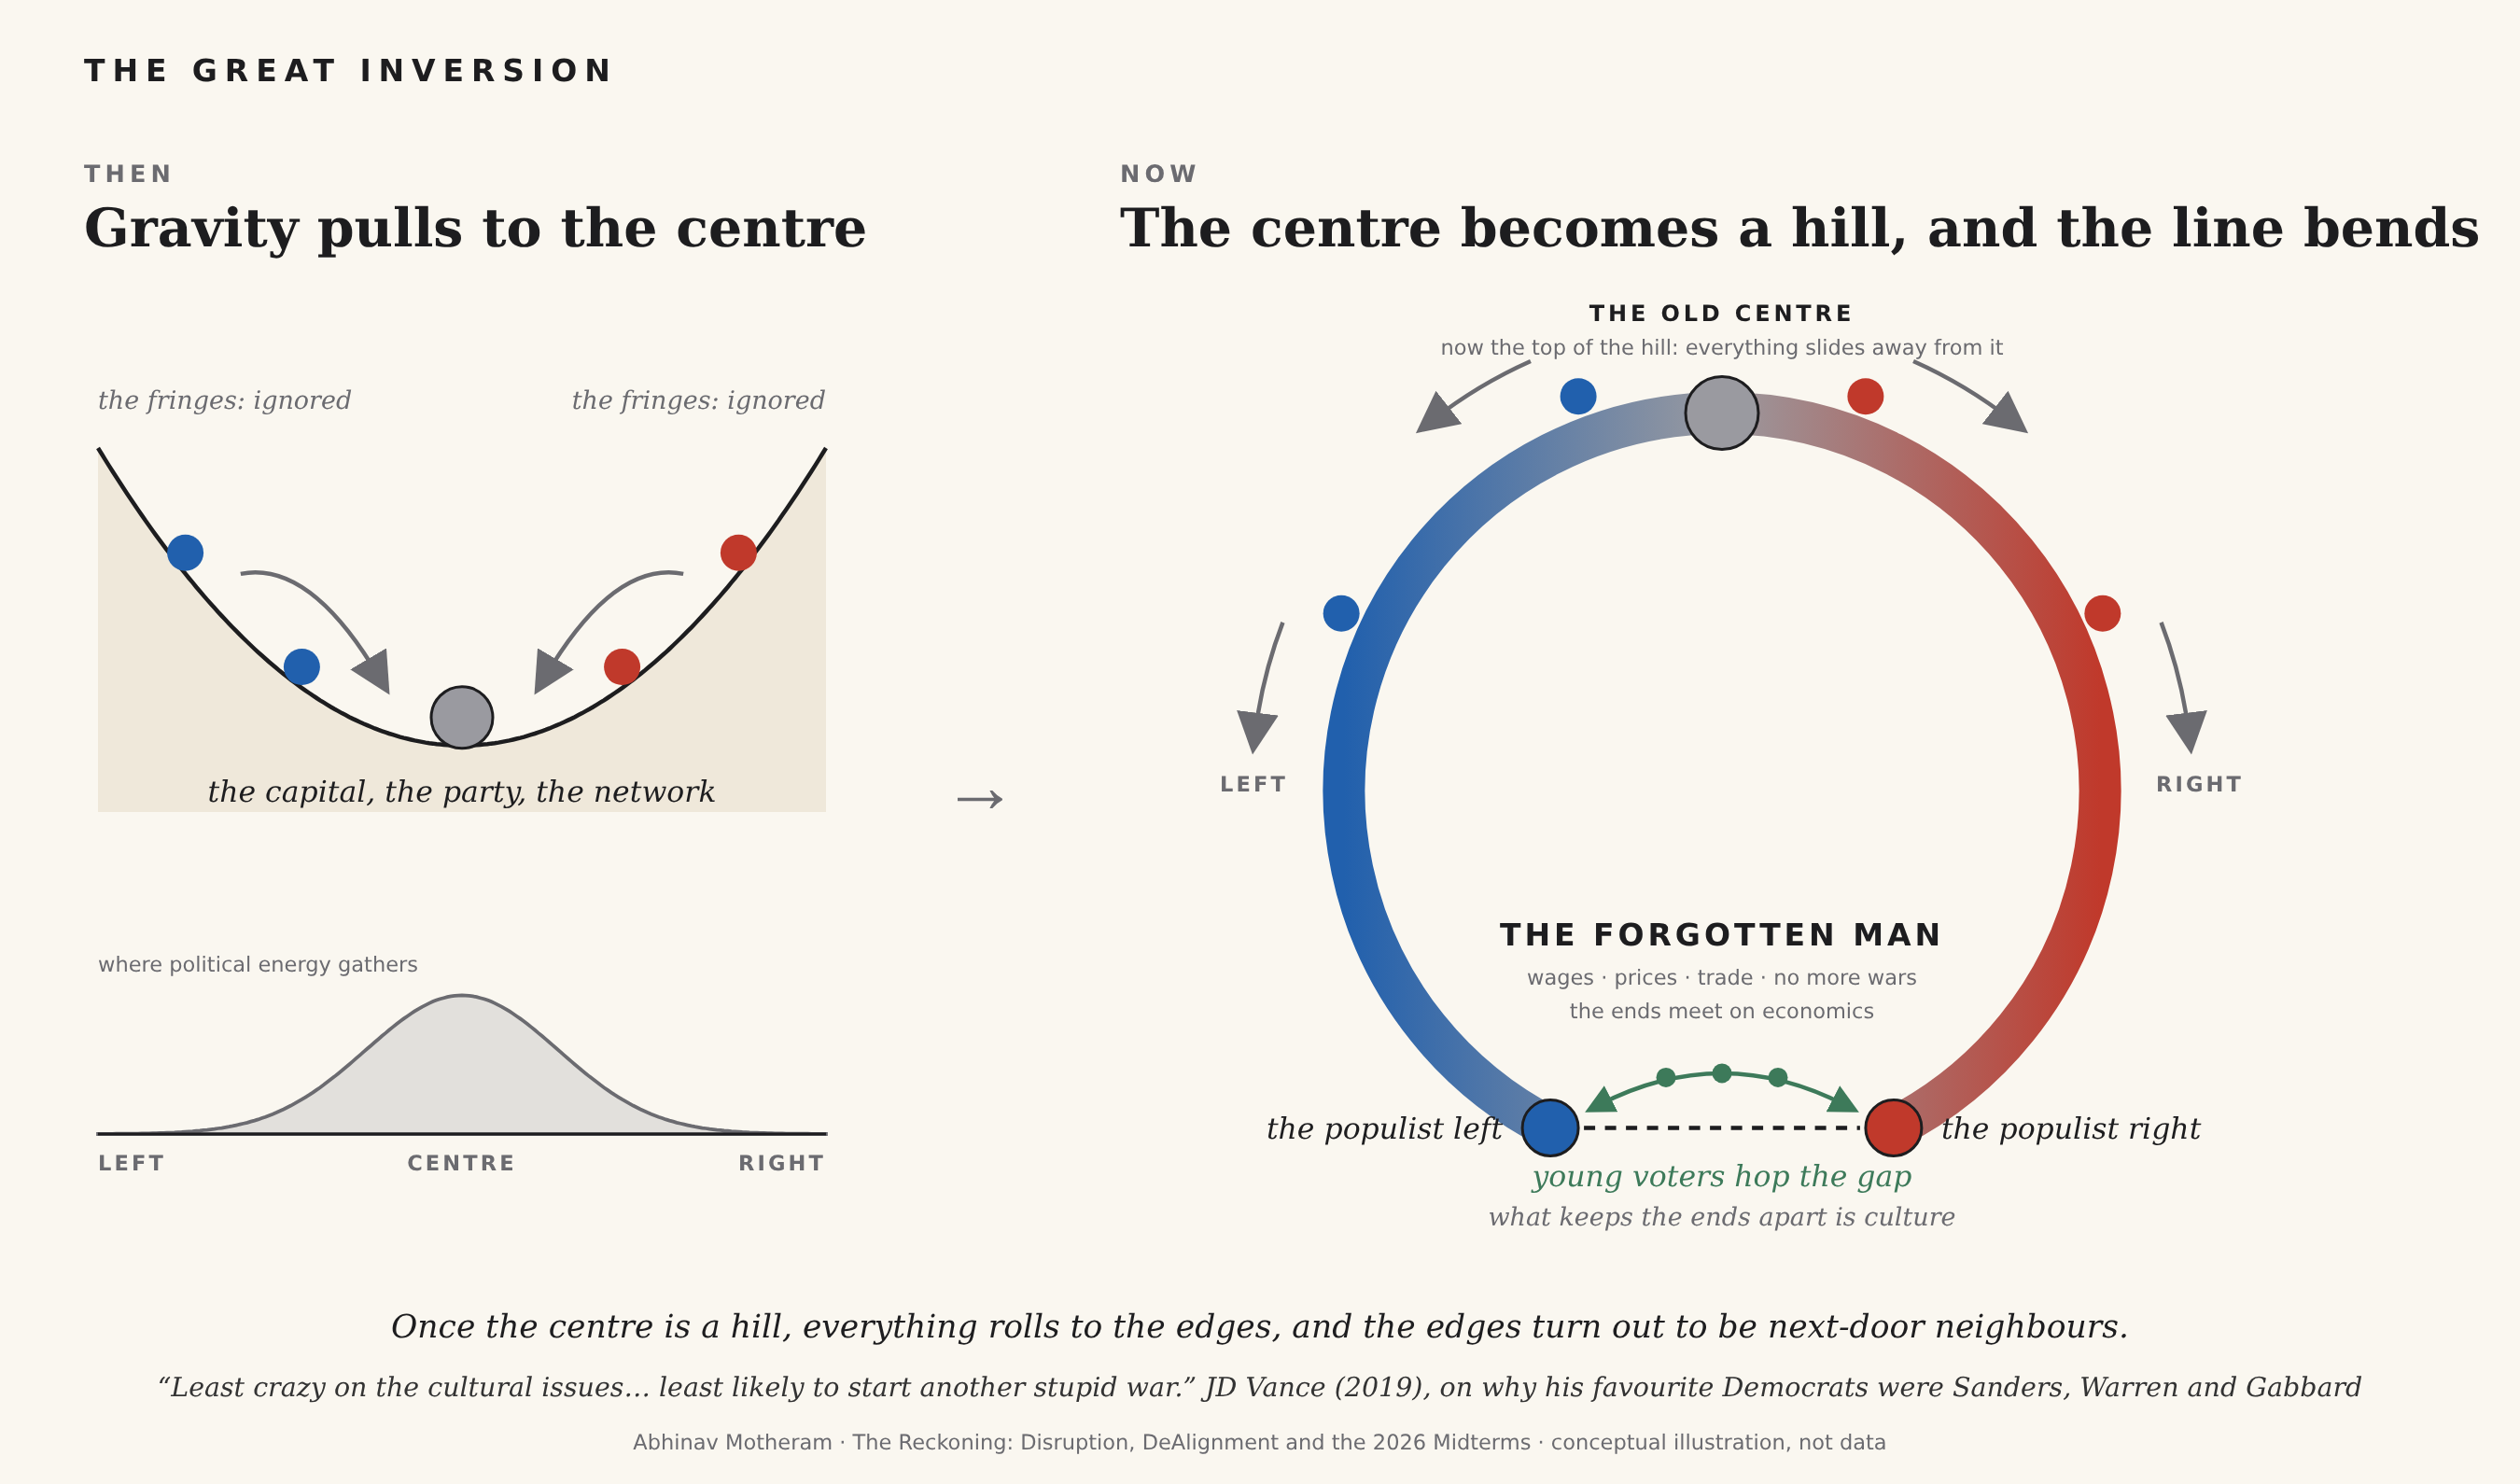
The figure is how I picture the Great Inversion. The populist fringes come close on economic grievances, including wages and access to housing, and on their opposition to foreign wars. Culture continues to divide them, often sharply. Shared grievances leave plenty of room for disagreement about what a government should actually do.
In this clip of JD Vance speaking in 2019, he recalls being asked at a Yale Federalist Society event to name his three favourite Democrats, “purely in terms of policy outcomes”. His answer, in order, was Bernie Sanders, Elizabeth Warren and Tulsi Gabbard:
“And the reason is that one, I think those are the three candidates who are least crazy on the cultural issues in the Democratic party. And two, I think those are the candidates that are least likely to start another stupid war.”
He also thought Sanders would beat Trump in 2020, “for some of the same reasons that Trump was a pretty strong candidate.”
I find that a revealing assessment from the man who is now Vice President. He recognised an appeal shared by Sanders and Trump, and put avoiding another war among his reasons for admiring politicians in the other party. My shorthand for the successful populist campaign is economic left, cultural right. It is admittedly rough, and it describes a campaign promise much better than it describes a governing record. The difficulty of keeping the economic and anti-war promises once in office is where Trump’s current problem begins.
Who was whose party, anyway? #
Before treating any of these coalitions as permanent, it is worth looking at how often they have changed. I put together the timeline below because the familiar account of a workers’ party facing an elites’ party can obscure a lot of American political history.
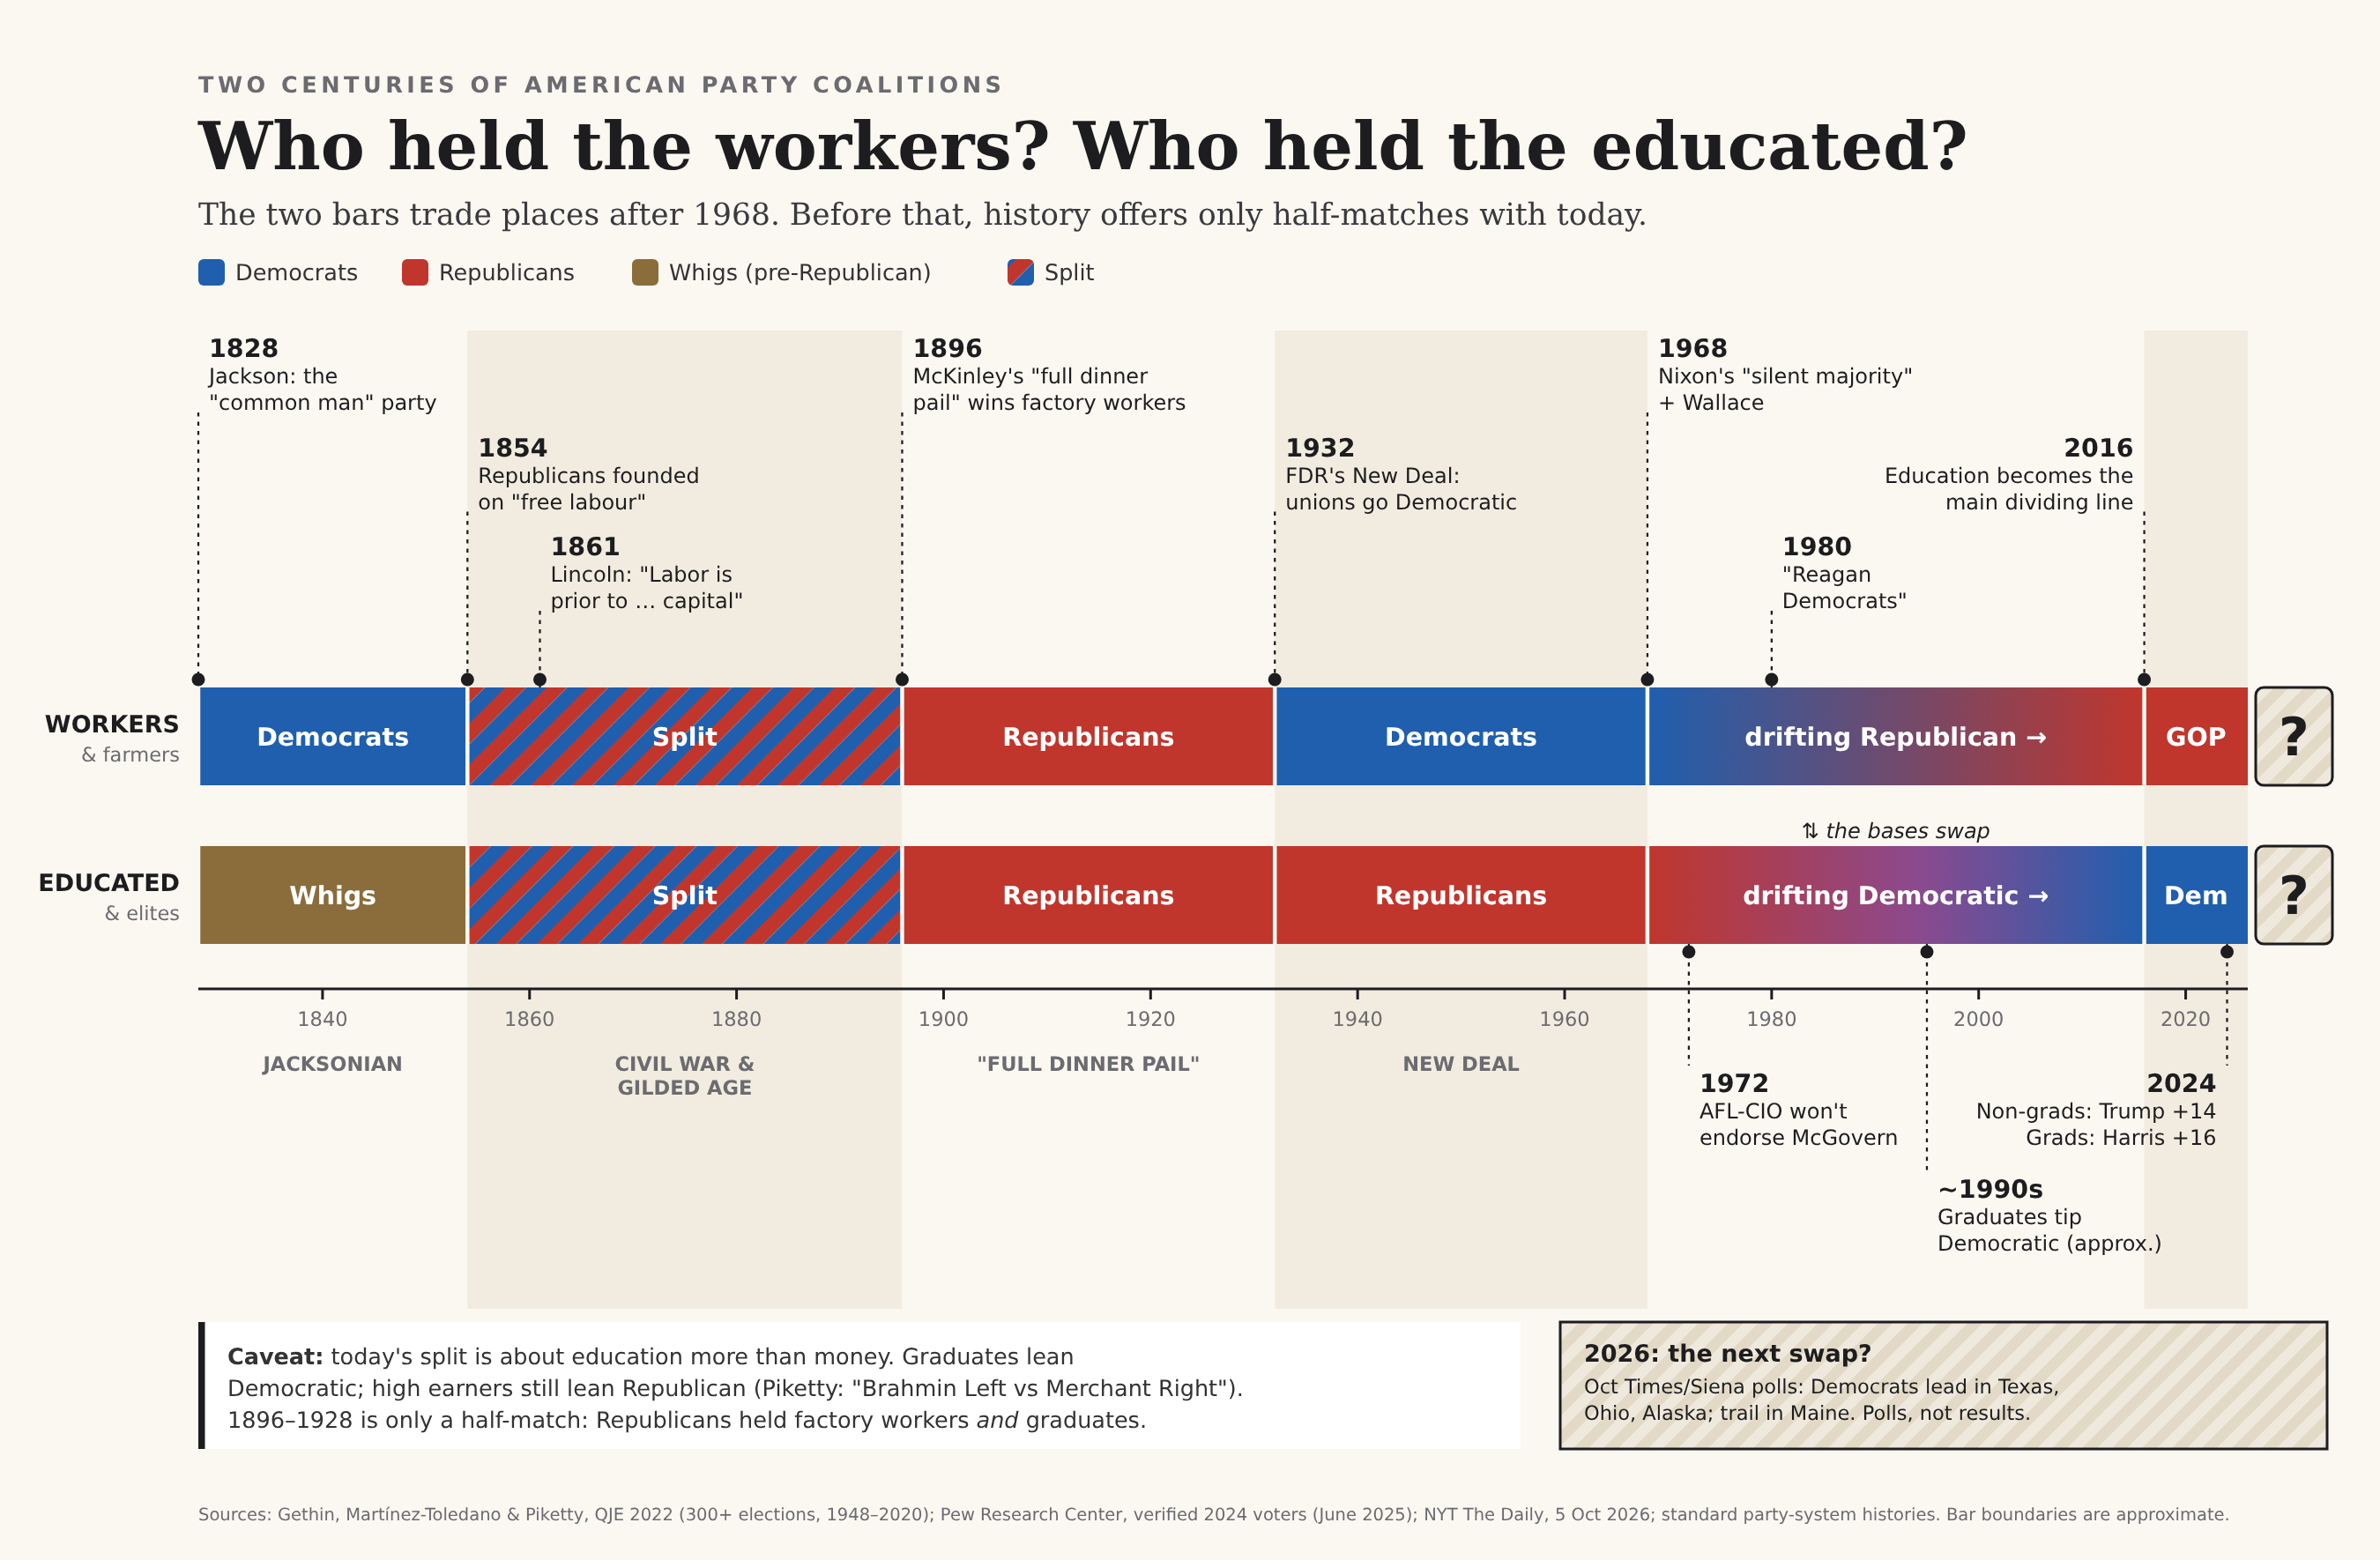
Jackson’s Democrats began as the party of the “common man”. The Republicans were founded in 1854 on “free labor”; Lincoln told Congress in 1861 that “Labor is prior to, and independent of, capital”. Both parties have grounds for invoking a working-class past, provided they choose the appropriate part of it.
The McKinley era is a particularly interesting comparison. His “full dinner pail” pitch in 1896 linked high tariffs to protected jobs and won factory workers in the North, while William Jennings Bryan’s Democrats became a rural, agrarian, populist party. Republicans dominated for most of the next three decades. The tariff parallel with Trump is hard to miss, although McKinley’s Republicans also held business, the professionals and the college-educated. There was no corresponding educated Democratic coalition of the kind we see today. The Depression eventually broke that coalition’s promise of prosperity.
From 1932 through the 1960s, the New Deal Democrats held the unions and the working class, while Republicans held business and college graduates. The change came gradually, through Nixon’s “silent majority”, the Reagan Democrats and Democratic gains among graduates. By 2016 education had become the main dividing line in American politics. Per Pew’s study of validated voters, graduates backed Harris by 16 points in 2024, non-graduates backed Trump by 14 points, and voters with postgraduate degrees went for Harris 65-33.
It should be noted that education and income tell somewhat different stories here. Gethin, Martinez-Toledano and Piketty (2022) examined over 300 elections across 21 Western democracies between 1948 and 2020. Left parties shifted from the less-educated in the 1950s and 60s towards the more-educated, while high-income voters remained on the right. Their description, “Brahmin Left versus Merchant Right”, is closer to the “Battle of Elites” I discussed in the previous post. Calling either side simply the workers’ party conceals the elites within its own coalition.
How loyal are these voters? #
Realignment, in V.O. Key’s 1955 essay, “A Theory of Critical Elections”, means voters changing parties and staying for a generation, as in 1896 and 1932. Dealignment allows for something less settled: a party can gain votes without gaining much loyalty. For those who read In Dialogue with Hirschman, this is another application of Exit, Voice, and Loyalty: dissatisfied voters can leave, abstain or punish their own candidate, while loyalty can keep them attached as they try to change the party. How much of Trump’s 2024 support survives governing? The same question will apply to Democrats if they gain those votes next week.
A note on the polls. These are dated snapshots, including different surveys of Texas. The October 3 and October 13 figures should not be read as one simultaneous result. Close races deserve the usual caution, particularly in a series which began with a polling miss.
1. More Americans are calling themselves independents.
Gallup reports that a record-high 45% of American adults identified as political independents in 2025, with 27% each identifying as Democrats or Republicans. Among Gen Z adults, 56% called themselves independents. That sounds like a large unattached electorate, until one looks at the leaners: only 10% lean to neither party. Gallup’s full split: 20% lean Democratic, 15% lean Republican and 10% lean to neither. People can dislike a party’s name and continue to vote for it reliably.
2. The dissatisfaction extends to both parties.
On The Daily on October 5th, Nate Cohn pointed out that it has been about 25 years since Americans were satisfied with the direction of the country. They have tried both parties during that period. Biden’s promise of normalcy did not satisfy them, and Trump is now being judged on his promises of lower prices and an end to foreign wars.
In the national NYT/Siena survey of October 21st, Trump’s approval is 36-59, falling to 29-69 on the cost of living. Democrats lead the House ballot by 10 points, but voters are dissatisfied with both parties. This is consistent with the observation from the first post that “people just aren’t that happy”. Democrats will benefit without having persuaded voters that they will do much better.
3. There is also discontent among the old-school Republicans.
Ohio, Texas, Iowa, Alaska and Kansas all voted for Trump by at least 11 points in 2024. Across these five states in the Times polling, his approval is now 40%, compared with the 56% of the vote he won. Cohn points out that all five voted against him in the 2016 Republican primary. His interpretation is that Reagan-Bush-Romney Republicans who accepted Trump against the Democrats remain uncomfortable with him.
A purely generational account would miss these voters. Someone can have a long Republican history and still be open to a particular Democrat when dissatisfied with the Republican candidate.
4. Voters are separating candidates from their parties.
In those five red states, voters say the Democratic Party is too far to the left, yet find the Republican candidate too far to the right and view the Democrat more favourably. In Kansas, Adam Hamilton, pastor of the largest United Methodist congregation in the country, is tied at 45-45 with the Republican incumbent, Roger Marshall. Hamilton has no voting record for his opponent to attack. All is not well in Kansas. In Texas, Ken Paxton, impeached by his own party, trailed Talarico by 6 (51-45) in the October 3rd Times poll, with a 23-point deficit on moral character.
Maine voted for Harris by 7 points and wants Democrats to control the Senate, yet Susan Collins led Troy Jackson by 3 in the Times poll. Other polls show Jackson ahead, to be fair. In Michigan, Abdul El-Sayed leads Mike Rogers 49-44 while Democrats lead the generic ballot by 10 in the same poll. Black voters back the Democratic candidate for governor 92-1, but El-Sayed by 76-13. These Maine and Michigan comparisons come from Cohn’s account on The Daily.
Democrats doing better in Texas than in Michigan and Maine – how does one square this circle?! The individual candidates matter more than a national party preference alone would suggest.
5. Senate results are diverging from presidential results again.
Pew’s historical comparison shows that in 1986, 59% of Senate races were won by the party that lost that state in the most recent presidential election. In 2006 it was still 30%. Since 2012, 91% of Senate contests (222 of 245) went the same way as the state’s presidential vote. In 2024 there were four mismatches out of 34: Arizona, Michigan, Nevada and Wisconsin voted for Trump and elected Democratic senators. That was the highest mismatch rate since 2017-18.
Texas supplies a more immediate comparison. Siena’s October 13 poll has Talarico ahead 48-44 for the Senate, while Republican Greg Abbott leads 48-47 for Governor. These are preferences expressed by the same survey electorate for contests on the same day. The historical Senate comparison involves separate elections, so it cannot by itself tell us how many individuals split their tickets.
6. Some of Trump’s 2024 gains are already looking fragile.
In chemistry, a free radical is an atom or molecule with an unpaired electron. I have been thinking of the less attached voters in similar terms, willing to form a new connection but also capable of moving again. Cohn describes the first voters to peel away as:
“the voters that gave them a chance for the first time in 2024. Young voters, Latino voters. These are not loyal Republicans, and they did not get what they thought they were voting for.”
Per Pew, Biden won Hispanic voters by 25 points in 2020; Harris won them by only 3 points in 2024. I was among those inclined at times to see this as the working class of every colour moving towards the Republicans. In the Times/Siena Texas poll, James Talarico has more than 60% of the Latino vote. Democrats had long treated demographic growth as a reason to expect an eventual permanent majority, a big assumption about people whose concerns about prices, the border, work and faith did not necessarily fit the party’s priorities. Republicans would be making a similar mistake if they now assumed these voters belonged to them.
Young men interest me particularly because their shift in 2024 fits Thompson’s argument about reaching people outside the established channels. In the first post, I discussed Trump’s appearances on podcasts and the contrast with Harris’s outreach. He went to the shows young men were already watching, including sports and gaming audiences. This helped him reach people for whom the usual political interview was unlikely to be appealing.
Don’t mistake that success for a durable Republican identity. The young voters in Gallup’s figures are especially likely to call themselves independents. Their willingness to listen to Trump came with little loyalty to his party, particularly if they expected lower prices and an end to foreign wars. The 2026 result will give us a better indication of how much support was conditional on those promises.
Young people trying to establish themselves also encounter an economy quite different from the one experienced by people who already own a home. That difference gets lost easily when politicians insist that the economy is doing well, and it deserves a little more space here.
It’s the economy, stupid #
My mentor used to love quoting James Carville’s line from Bill Clinton’s 1992 campaign: “It’s the economy, stupid.” I discussed the macroeconomics behind Trump’s programme in The Trump 2.0 Doctrine. The fiscal reset I entertained there was conditional. The question here is whether the people who voted for him think he has delivered. They don’t.
Kevin Hassett, director of the National Economic Council, told Larry Kudlow on Fox Business on October 27th that the “affordability crisis is a myth”:
“if you adjust for inflation, adjust for changes in prices, that Americans are a trillion dollars better off than they were when President Trump took office, so this whole idea about affordability the way they are presenting it is inconsistent with the data.”
Kudlow called high gasoline prices “temporary and necessary”, because “we have to stop Iran’s nuclearization”. It is revealing that this sits alongside a dismissal of the affordability crisis. The household paying the higher price is being asked to accept the cost while also accepting that its complaint is inconsistent with the data.
In the Reuters/Ipsos poll reported by CNBC-TV18, half of registered voters – 53% of Republicans and 49% of Democrats – named the cost of living as the single most important issue for their vote, up from 47% in August. Pew finds 84% of registered voters saying the economy is very important to their midterm vote.
We have been through a version of this under Biden. Kyla Scanlon coined vibecession in 2022 to describe the gap between an economy that looked healthy in the data and voters’ much gloomier assessment. Strong jobs numbers and falling inflation did little to persuade those voters. Trump now faces the same difficulty, with officials from the other party explaining why the public ought to feel better.
I happen to think there is a measurement problem here – and a big one. In February 2024, Larry Summers and three co-authors published “The Cost of Money is Part of the Cost of Living”. Summers had served as Clinton’s Treasury Secretary and Obama’s National Economic Council director, so this was hardly a criticism from outside the Democratic economic establishment. Their argument was that rising borrowing costs helped explain the difference between consumer sentiment and the usual economic indicators:
“the cost of money is not currently included in traditional price indexes”
Until 1983, the CPI tracked homeownership costs including mortgage payments. On that older method, the paper estimates, headline CPI inflation would have peaked at 18% in November 2022 – against an official peak of 9.1% – right when consumer sentiment hit its lows. This does not settle how we should construct a price index, but it does give us a reason to take the dissatisfaction seriously.
The price of the house itself is another part of the problem. In the United States, the CPI dropped house prices in 1983 and replaced them with “owners’ equivalent rent”, an estimate of what homeowners would pay to rent their own homes. For measuring the consumption of shelter, that is a defensible choice. For someone trying to buy a home, it leaves out an important cost.
Charles Goodhart – yes, that Goodhart – made the case for including asset prices in “What Weight Should be Given to Asset Prices in the Measurement of Inflation?”, published in the Economic Journal in 2001. Alongside Alchian and Klein’s theoretical argument from 1973, he emphasised the practical case for housing. In their later work, Goodhart and Boris Hofmann pointed to the dictionary definition of inflation as a fall in the value of money. The narrower consumer-price measure can miss that loss of purchasing power when it occurs in assets.
For someone who has yet to buy a home, both the price of the house and the cost of borrowing to buy it matter. Goodhart and Summers help explain why a consumption index can coexist with an affordability problem that people find quite impossible to ignore.
The chart below uses the FRED series listed in the Sources. Between January 2000 and December 2025, the Case-Shiller national index of US home prices rose by 227%. Consumer prices rose by 92%, the CPI’s measure of rents by 143%, and average hourly wages of production and non-supervisory workers by 132%. Adjusted for inflation, median weekly earnings rose by about 13% between early 2000 and the third quarter of 2025. Measured against wages, the price of a home rose by about 40%.
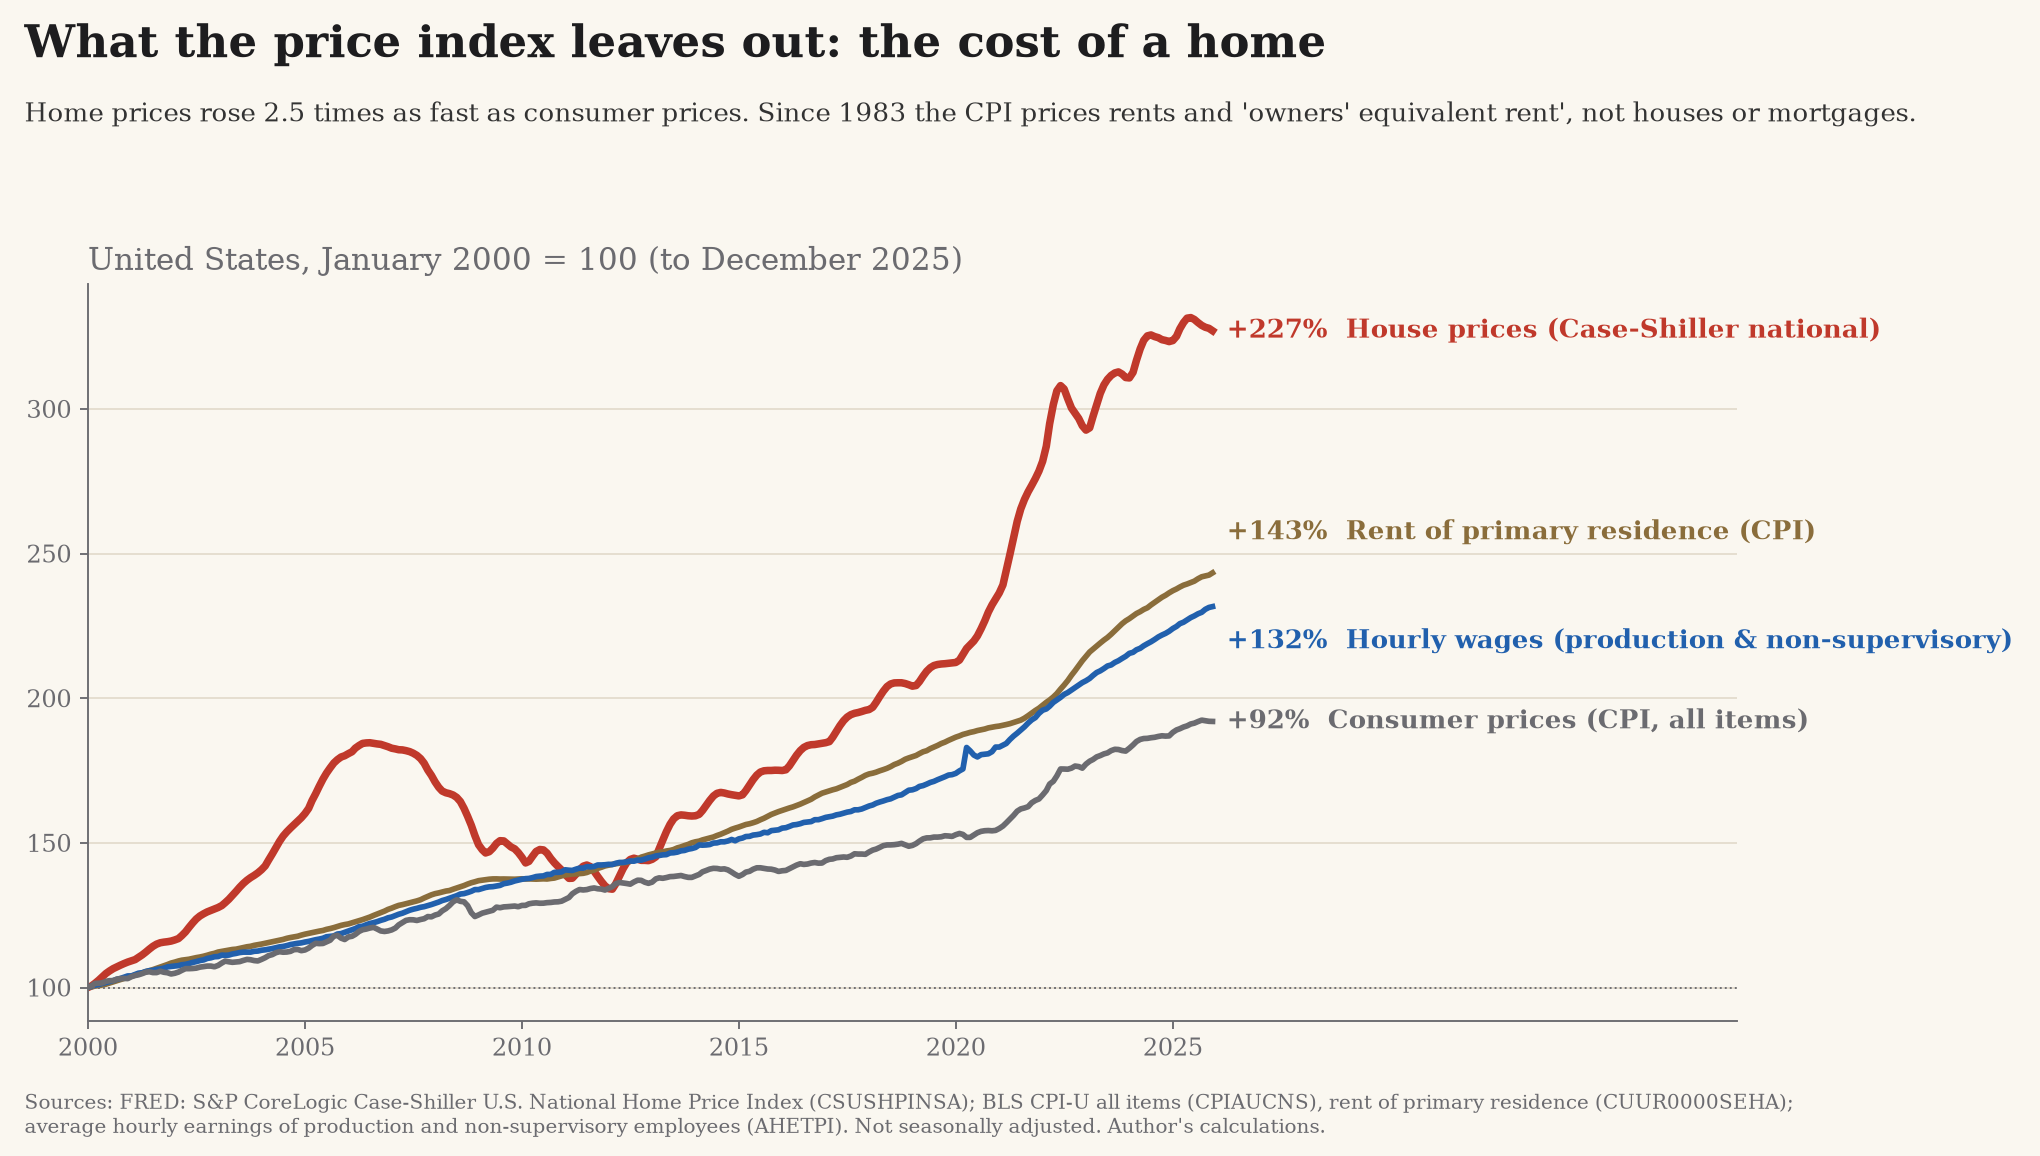
The post-COVID experience made this more difficult. Between January 2020 and the peak in June 2022, home prices rose by 45%, three times the increase in consumer prices (15%). The 30-year mortgage rate went from 2.65% in January 2021 to 7.79% in October 2023. A new buyer faced a much more expensive house and much more expensive borrowing.
To illustrate the payment involved, take the median price of a new home sold in the United States, put 20% down and borrow the rest for 30 years at the average rate of the year. Monthly principal and interest, before taxes and insurance, was about $1,285 in 2021 and about $2,121 in 2025, a rise of 65%. Median household income rose by 24% over those years. The payment went from about 22% to about 29% of the median household’s income. Over the longer period, the median new home cost about 3.6 times median annual household income in 1985 and about 4.75 times in 2025.
For the statistically inclined
The payment comparison uses a 20% down payment, a 30-year loan and each year’s average mortgage rate. It covers principal and interest before taxes and insurance. These are modelled payments, rather than an observed household’s mortgage.
The inputs are FRED’s median sales price of new houses (MSPUS), median household income (MEHOINUSA646N) and the 30-year fixed mortgage rate (MORTGAGE30US).
The chart’s other listed series are CSUSHPINSA, CPIAUCNS, CUUR0000SEHA, AHETPI and LES1252881600Q. They measure home prices, consumer prices, rents, hourly wages and real median weekly earnings. Their growth rates should not be treated as a single household’s experience.
To be fair to the statisticians, a house is an investment as well as a place to live. House prices are volatile and no two houses are alike. The CPI was designed to measure consumption, and there are good reasons for constructing it that way. My objection is to using it as a sufficient answer to people describing their difficulty in buying a home.
Shelter is about 36% of the US CPI and owners’ equivalent rent about 26%, so housing consumption is already a very large part of the index. Yet the Bureau of Labor Statistics states that “owned housing units themselves are not priced”. The distinction matters for the claims politicians make on the basis of these numbers. It also raises questions about inflation targeting, although the Fed targets the PCE price index, whose treatment of homeowners also relies on imputed rent. I will leave the fuller Goodhart’s Law argument for another post.
To be fair, about two in three households own their home, and that is a big caveat to all of this. Many have mortgages fixed at pandemic-era rates and have gained wealth on paper as house prices rose. We cannot take the experience of a young renter and describe all Americans as if they were in the same position. I am concerned here with people who have yet to buy and have little attachment to the existing economic arrangement. A challenger promising to improve it has an audience among them, even while many established homeowners are doing reasonably well.
Nor is this only an American problem. India has its own vibecession debate – T.C.A. Anant’s piece on it is well worth a read – and the gap between what the official numbers say and what people feel has widened almost everywhere since COVID. The common thread is asset prices: real estate in particular, and the rents earned by whoever already owns the scarce thing more broadly. Our price indices were designed to measure the cost of consumption. They were never built to see what it costs to get in – to buy the first home, to borrow for it, to pay rent to someone who bought earlier.
That is why the dismissal matters. Two successive administrations – Biden’s, with its charts of falling inflation, and Trump’s, with Hassett’s “myth” – have told voters that their complaints were just vibes. Both had the data on their side, and both are losing the argument. There is no clearer picture of a centre disconnected from its voters.
The remedy will not come from better speeches. Governments across the world will have to tax assets, and land in particular, at higher rates, and incomes and wages at lower ones. That deserves a fuller treatment, and a separate post, and it will get one. For now, the point is simple: we are measuring the economy wrong. It is a big deal today, and it will be a bigger one over the coming years and decades.
The disruptor’s dilemma #
Trump now has to answer for the government he runs. He holds the White House, his party and both chambers of Congress, with considerable influence over the courts. The voters who supported him as a challenge to Washington are entitled to judge what he has done with that power. Gurri’s difficulty of turning opposition into government applies here, although it does not fully explain the failure as I see it.
I think Trump’s hubris, particularly his betrayal of the anti-war promise to the forgotten man, is going to cost him this election. He reached voters whom both parties had neglected and told them they would be forgotten no longer. Ending the wars of the Washington establishment was central to that appeal. Going to war with Iran asks those same voters to bear precisely the kind of cost they thought they had voted against.
I cannot establish Trump’s motive from the fact of the war. He came to believe he could disregard the promises that had brought him to power. For voters who took the anti-war promise seriously, there is a limit to how much can be excused as the necessary business of governing. Higher prices make the disappointment more immediate, especially when officials call the affordability crisis a myth.
The outsider gains power by reaching a neglected constituency, then governs alongside the established interests that constituency distrusted. If he abandons the promises which made him relevant to it, he gives the next challenger an opportunity. This is the difficulty I mean by the disruptor’s dilemma. Becoming an incumbent alone does not force that outcome; the decisions taken in office matter, and in Trump’s case the war is the breach.
The Indian parallels are worth keeping in mind. AAP, born from an anti-corruption movement, won 67 of Delhi’s 70 seats in 2015 and lost the city in 2025. Modi became the centre of Indian politics after disrupting the Congress order, and in 2024 the BJP fell to 240 seats and lost its own majority. Those results have their own explanations. They show that an outsider’s victory is no protection against the discontent that brought him to power.
I expect a Republican defeat to damage Trump personally as well as the movement built around him. I also expect Democrats to benefit from voters whose confidence in them remains limited. If they take those votes as evidence that their own party has become permanently attractive, they will be making much the same assumption I am questioning about the Republican reading of 2024.
The obvious objection is that this might just be a midterm: both 2006 and 2018 produced waves against an unpopular Republican President without establishing lasting dealignment. Hamilton’s appeal and Paxton’s liabilities could produce unusual results through candidate quality alone. Then there is the education divide, which survived 2020 and 2024; one midterm is unlikely to undo a 50-year trend. The objection I find hardest to answer concerns the theory itself. If political disruption explains Trump winning and losing, Bernie and Modi, and AAP’s rise and fall, how much is it actually explaining? It helps organise what I am seeing, but cannot produce a forecast on its own. Finally, dissatisfied Republicans may abstain rather than convert, leaving those who vote as loyal as ever. Having written at length about turnout after 2024, I should be especially careful about claiming conversions from aggregate vote shares: we will need evidence about those who stayed home, not just exit polls.
Conclusion #
For those who have persisted thus far, the interesting question after a Republican defeat is whether Democrats can retain the people who voted for them. They would be taking office with many of the same difficulties that have made voters dissatisfied with successive governments. One midterm, however large the victory, does not make a permanent coalition.
In India, the “Congress System”, as Rajni Kothari called it, cracked in the state elections of 1967. The decades of coalition politics that followed preceded the BJP’s new dominant coalition. The American process will have its own course, but that experience gives some sense of how long it can take for a new arrangement to emerge from political churn.
Here is how I intend to grade my reading on November 3rd:
- My forecast is that Republicans lose the House and could lose 5-10 Senate seats, including in Texas, South Carolina and Kansas, and maybe even Florida. Around 5 Senate losses would count as the direction holding; wins in Kansas, Texas or South Carolina, after their long runs without electing a Democratic senator, would make it the big dent in Trumpism. If the House flips but the Senate holds, it is a mixed result: the direction holds, the strength doesn’t. If Republicans hold both chambers, my disruption reading of 2026 is wrong.
- For split results, the threshold is five or more of the 35 races: the Senate winner’s party differs from the state’s 2024 presidential choice (4 out of 34 in 2024). Collins holding Maine alongside Democratic gains in red states would support this reading; a one-direction sweep with Collins losing could meet the threshold and still be an ordinary wave.
- Texas is the same-day test: Talarico winning while Abbott holds the Governor’s mansion. Even that would not identify individual ticket-splitters without further evidence.
- Compare the House swing since 2024 among young voters, especially young men, with older voters, and watch whether Talarico gets around 60% of Latino voters. Larger Democratic swings among the young and Latino movement towards their 2020 numbers would support temporary attachment; young men holding steady for Republicans while everyone else moves would count against my reading of them.
- Compare college and non-college House margins with Pew’s 16 and 14 point margins in 2024. A larger Democratic swing among non-graduates would support the transition argument; similar swings with the education gap intact would give me less reason to see more than a midterm. Exit polls and the AP Voter Poll, AP’s successor to VoteCast, differ methodologically from Pew, so small differences deserve caution.
Changes in turnout can produce apparent swings without individual switching. If the swing is uniform, the education gap holds and split Senate outcomes remain few, I will have to accept that the result gives little support to my Great DeAlignment reading. Even a result in the other direction will require more than election-night evidence to establish a durable change in loyalty.
I will come back to the scorecard after the results, including the parts I got wrong. The questions about inflation measurement and Goodhart deserve a separate post too. Stay tuned.
Sources #
- Pew Research Center, “Voting patterns in the 2024 election” (June 26, 2025) – https://www.pewresearch.org/politics/2025/06/26/voting-patterns-in-the-2024-election/
- Pew Research Center, “2024 elections show more partisan splits between states’ presidential and Senate votes than in recent past” (November 26, 2024) – https://www.pewresearch.org/short-reads/2024/11/26/2024-elections-show-more-partisan-splits-between-states-presidential-and-senate-votes-than-in-recent-past/
- Gallup, “New High of 45% in U.S. Identify as Political Independents” (2026) – https://news.gallup.com/poll/700499/new-high-identify-political-independents.aspx
- Siena Research Institute / NYT, Senate polls of Alaska, Iowa, Kansas, Ohio and Texas (October 3, 2026) – https://sri.siena.edu/2026/10/03/nytimes-siena-poll-of-likely-voters-senate-races/
- Siena Research Institute / NYT, National survey (October 21, 2026) – https://sri.siena.edu/2026/10/21/new-york-times-siena-national-survey/
- Siena Research Institute, Texas poll (October 13, 2026) – https://sri.siena.edu/2026/10/13/talarico-maintains-small-lead-over-paxton/
- The New York Times, The Daily, “Midterm Surprise: Democrats Are Surging in Red America”, with Nate Cohn (October 5, 2026)
- Gethin, A., Martinez-Toledano, C. and Piketty, T. (2022). “Brahmin Left Versus Merchant Right: Changing Political Cleavages in 21 Western Democracies, 1948-2020”. Quarterly Journal of Economics, 137(1), 1-48. https://doi.org/10.1093/qje/qjab036
- Key, V.O. (1955). “A Theory of Critical Elections”. The Journal of Politics, 17(1), 3-18.
- Hirschman, A.O. (1970). Exit, Voice, and Loyalty. Harvard University Press.
- Exponent, Episode 012: “The Internet Rainforest”, Ben Thompson and James Allworth (August 7, 2014) – https://exponent.fm/episode-012-the-internet-rainforest/
- Gurri, M. (2018). The Revolt of the Public and the Crisis of Authority in the New Millennium. Stripe Press (first published 2014).
- JD Vance, remarks reportedly at The American Conservative’s 2019 gala (clip, quotation at 0:00-0:44) – https://youtube.com/shorts/MUj5gVwz3sI
- Fox Business, Kudlow, “Kevin Hassett: This is a ‘MYTH’” (October 27, 2026), quotation at 2:56-3:21 – https://www.youtube.com/watch?v=2YZPX9mprVo
- Reuters/Ipsos poll on the cost of living, via CNBC-TV18 (October 27, 2026) – https://www.cnbctv18.com/world/us-midterm-elections-2026-affordability-cost-of-living-20019766.htm
- Pew Research Center, “Economy Ranks as Top Issue in Midterms for All Voters” (October 8, 2026) – https://www.pewresearch.org/politics/2026/10/08/economy-ranks-as-top-issue-in-midterms-for-all-voters-but-partisans-differ-over-the-importance-of-other-issues/
- Bolhuis, M., Cramer, J., Schulz, K. O. and Summers, L. H. (2024). “The Cost of Money is Part of the Cost of Living: New Evidence on the Consumer Sentiment Anomaly”. NBER Working Paper 32163. https://www.nber.org/papers/w32163
- Goodhart, C. (2001). “What Weight Should be Given to Asset Prices in the Measurement of Inflation?” The Economic Journal, 111(472), F335-F356. https://doi.org/10.1111/1468-0297.00634
- Goodhart, C. and Hofmann, B. (2007). House Prices and the Macroeconomy: Implications for Banking and Price Stability. Oxford University Press (chapter “What Role for House Prices in the Measurement of Inflation?”).
- FRED, Federal Reserve Bank of St. Louis: CSUSHPINSA, CPIAUCNS, CUUR0000SEHA, AHETPI, LES1252881600Q, MSPUS, MEHOINUSA646N, MORTGAGE30US (accessed October 30, 2026; author’s calculations) – https://fred.stlouisfed.org
- U.S. Bureau of Labor Statistics, “Measuring Price Change in the CPI: Rent and Rental Equivalence” (relative importance, December 2025) – https://www.bls.gov/cpi/factsheets/owners-equivalent-rent-and-rent.htm
- T.C.A. Anant, “Are we in a vibecession?” (October 15, 2026) – https://tcaanant426616.substack.com/p/are-we-in-a-vibecession